
Kuvatud on postitused sildiga Paper. Kuva kõik postitused
Kuvatud on postitused sildiga Paper. Kuva kõik postitused
Mine water as a potential source of energy from underground mined areas
Mine water as a potential source of energy from underground mined areas in Estonian oil shale deposit

Possibilities of mining under the mire
Paper: Possibilities of oil shale mining under the Selisoo mire of the Estonian oil shale deposit
txt: See discussions, stats, and author profiles for this publication at: https://www.researchgate.net/publication/236005585 Possibilities of oil shale mining under the Selisoo mire of the Estonia oil shale deposit Article in Environmental Earth Sciences · December 2013 DOI: 10.1007/s12665-013-2396-x CITATIONS 17 READS 98 5 authors, including: Some of the authors of this publication are also working on these related projects: Rikastamine View project Vivika Väizene Tallinn University of Technology 91 PUBLICATIONS 250 CITATIONS SEE PROFILE Juri-Rivaldo Pastarus Tallinn University of Technology 36 PUBLICATIONS 61 CITATIONS SEE PROFILE Ylo also Ülo also in Russian Юло Joann Systr… Tallinn University of Technology 15 PUBLICATIONS 45 CITATIONS SEE PROFILE Ingo Valgma Tallinn University of Technology 404 PUBLICATIONS 1,503 CITATIONS SEE PROFILE All content following this page was uploaded by Ingo Valgma on 11 March 2015. The user has requested enhancement of the downloaded file. All in-text references underlined in blue are added to the original document and are linked to publications on ResearchGate, letting you access and read them immediately. Look Inside Get Access Find out how to access previewonly content Environmental Earth Sciences December 2013, Volume 70, Issue 7, pp 33113321 Date: 27 Mar 2013 Possibilities of oil shale mining under the Selisoo mire of the Estonia oil shale deposit Abstract The paper presents results of the study on oil shale mining (Estonia underground mine) possibilities under the Selisoo mire. The Selisoo area is 2,051 ha in extent, and most of the mire is in natural state. Peat layer consists of thick (4.4–6.5 m) oligotrophic peat. Mining under Selisoo will go at depths 65– 70 m under the surface. The mining field of the Estonia mine was planned between Ahtme and Viivikonna fault zones. The lowest hydraulic conductivity of carbonate rocks 0.11 l/day per m2 is found in the Oandu layer and for peat it is 0.35–0.0002 m/day. Therefore, together they form a good aquitard. When the annual rainfall amount is the highest, the difference between horizontal water inflow and runoff is positive with 127,000 m3 . Positive water balance is guaranteed in case of precipitation being at least 540 mm/year. The positive water balance is important for preserving the ecological system of Selisoo mire. For guaranteeing longterm stability of mine pillars, a new calculation method has been elaborated, based on the conventional calculation scheme, where the factor of safety is more than 2.3. Rheological processes are out of question, collapse of the pillars is impossible. Stability of the underground constructions and overburden rocks must be “eternal”. The criteria were elaborated for oil shale mining and will guarantee preservation of mires in natural or close to natural state. Article Metrics Citations 5 Social Shares References (52) 1. Botch MS, Masing VV (1979) Ecosystems of USSR. Nauka, Leningrad. [in Russian] 2. Fetter CW (1994) Applied hydrogeology, 3rd edn. Macmillan College Publishing Company, Inc, New York, Library of Congress CataloginginPublication Data, pp 1– 691 3. Hints L (1997) Aseri Stage Lasnamägi Stage Uhaku Stage Kukruse Stage Haljala Stage. In: Raukas A, Teedumäe A (eds) Geology and mineral resources of Estonia. Estonian Academy Publishers, Tallinn, pp 66–72 4. Hints L, Meidla T (1997) Keila Stage Oandu Stage Rakvere Stage Nabala Stage. In: Teedumäe A, Raukas A (eds) Geology and mineral resources of Estonia. Estonian Academy Publishers, Tallinn, pp 74–81 5. Huang S, Li X, Wang Y (2012) A new model of geoenvironmental impact assessment of mining: a multiplecriteria assessment method integrating FuzzyAHP with fuzzy synthetic ranking. Environ Earth Sci 66(1):275–284. doi:10.1007/s126650111237z CrossRef 6. Ivanov KE (1975) Water exchange in peatlands. Gidrometeoizdat, Leningrad, pp 86–91 [in Russian] 7. Joosten H, Clark D (2002) Wise use of mires and peatlands. International Mire Conservation Group, International Peat Society, Saarijärvi, p 303 8. Jõgar P (1983) Groundwater flow models of Pandivere Upland (northeast Estonia). In: Proceedings of academy of sciences of ESSR. Geology 32, 2, 69–78 [In Russian, summary in English] 9. Karu V, Västrik A, Anepaio A, Väizene V, Adamson A, Valgma I (2008) Future of oil shale mining technology in Estonia. Oil Shale 25(2S):125–134 CrossRef 10. Kattai V, Vingisaar P (1980) Structure of the Ahtme tectonic disturbance. In: Proceeding of the academy of sciences ESSR. Geology 29, 2, 55–62 [In Russian, summary in English abstract] 11. Ketcheson SJ, Price JS (2011) The impact of peatland restoration on the site hydrology of an abandoned blockcut bog. Wetlands 31(6):1263–1274. doi:10.1007/s13157011 02410 CrossRef 12. Kink H (1997) Karst and springs. In: Teedumäe A, Raukas A (eds) Geology and mineral resources of Estonia. Estonian Academy Publishers, Tallinn, pp 389–390 13. Koitmets K, Reinsalu E, Valgma I (2003) Precision of oil shale energy rating and oil shale resources. Oil Shale 20(1):15–24 14. Loopmann A (1996) Formation, development and perishing of mire massis. Development of mires and formation of bedpool complex. J Estonian Peat 3(4):18–21 [in Estonian, with English summary] 15. Lu W, Luo Y, Chen M et al (2012) An introduction to Chinese safety regulations for blasting vibration. Environ Earth Sci 67(7):1951–1959. doi:10.1007/s1266501216369 CrossRef 16. Mininglaw and legal regulation acts (1998) Ministry of Environment, Ministry of Economy. Part II, Tallinn, (in Estonian) 17. Nestor H, Soesoo A, Linna A, Hints O, Nõlvak J (2007) Ordovician in Estonia and southern Finland. MTÜ GEOGuide Baltoscandia, Tallinn, pp 1–32 18. Niinemets E, Pensa M, Charman D (2011) Analysis of fossil testate amoebae along the hummocklawnhollow gradient in Selisoo Bog, Estonia: local variability and implications for palaeoecological reconstructions in peatlands. Boreas 40:367–378 19. Orru H, Orru M (2006) Sources and distribution of trace elements in Estonian peat. Symposium on peatlands—basin evolution and depository of records on global environmental and climatic changes location: Florence, Italy. Glob Planet Change 53(4):249–258. doi:10.1016/j.gloplacha.2006.03.007 CrossRef 20. Orru M (1975) Report of explorationinvestigation works of peat deposits in KohtlaJärve County. Manuscript at depository of manuscript reports of geological survey of Estonia. Geological survey of Estonia, Tallinn (in Estonian, with Russian summary) 21. Orru M (1995) Estonian mires. Geological Survey of Estonia, Tallinn (in Estonian, with English summary) 22. Orru M (2010) Dependence of Estonian Peat deposit properties on landscape types and feeding conditions. PhD thesis, Publication of Tallinn University of Technology, Tallinn, pp 121 23. Orru M, Lelgus M (2003) Peat resources investigation of Soosaare peatland in Viljandi County, the Geological Survey of Estonia, Tallinn, pp 33 24. Orru M, Orru H (2008) Sustainable use of Estonian peat reserves and environmental challenges 15th Meeting of the AssociationofEuropeanGeologicalSocieties location: Tallinn, Estonia Date: Sep 16–20. Estonian J Earth Sci 57(2):87–93. doi:10.3176/earth.2008.2.04 CrossRef 25. Orru M, Uebner M, Orru H (2011) Chemical properties of peat in three peatlands with balneological potential in Estonia. Estonian J Earth Sci 60(1):43–49. doi:10.3176/earth.2011.1.04 CrossRef 26. Parker I (1993) Mine pillar design in 1993: computers have become the opiate of the mining engineers. Mining engineering, 1993, July and August, 714–717 and 1047–1050 27. Pastarus JR (2005) Improved underground mining design method for Estonian oil shale deposit. 5th international scientific and practical conference on environment, technology and resources. Latvia, Rezekne, pp 270–274 28. Pastarus JR, Sabanov S (2005) Concept of risk assessment for Estonian oil shale mines. In: Proceedings of the 5th international conference “environment technology resources”, Rezekne Augstskolas Izdevnieciba, Rezekne, Latvia, June 16–18, 2005, 237–242 29. Pastarus JR, Toomik A (2001) Roof and pillar stability prognosis in Estonian oil shale mines. Rock Mechanics. In: Särkka P, Eloranta P (eds) Proceedings of the ISRM Regional Symposium EUROCK 2001 “Rock Mechanics a challenge for society”. A.A.Balkema/Lisse/Abingdon/Exton (PA)/Tokyo, Espoo, 849–853 30. Pastarus YR, Nikitin O (2003) Estimation methods for stability of mining excavations (on the example of shale oil deposit in Estonia). Gornyj Zhurnal Ruda i Metally 4–5:71– 75 (in Russian) 31. Peat Handbook 1982. Nedra, Moscow, 753 (in Russian) 32. Perens R (2005) Groundwater stand in 1999–2003. Geological Survey of Estonia, Tallinn (in Estonian) 33. Perens R, Vallner L (1997) Waterbearing formation. In: Teedumäe A, Raukas A (eds) Geology and mineral resources of Estonia. Estonian Academy Publishers, Tallinn, pp 163–177 34. Puura V, Vaher R (1997) Tectonics. In: Raukas A, Teedumäe A (eds) Geology and mineral resources of Estonia. Estonian Academy Publishers, Tallinn, pp 163–177 35. Reinsalu E (2001) Post technological processes in mined out areas. Estonian Science Foundation, Grant No. 3403, Tallinn (in Estonian) 36. Reinsalu E, Valgma I (2007) Oil shale resources for oil production. Oil Shale 24:9–14 37. Riet K (1974) About transmission capacity of Ordovician carbonate rock in the Estonia oil shale deposit. In: Proceeding of the academy of sciences ESSR. Chemistry. Geology 23, 3, 274–277 38. Regulation to room, pillars and safety zones calculation methods for underground oil shale mining (1997). Tallinn, pp 28 (in Estonian) 39. Sabanov S, Tohver T, Väli E, Nikitin O, Pastarus JR (2008) Geological aspects of risk management in oil shale mining. Oil Shale 25(2):145–152 CrossRef 40. Scott B, Ranjtih PG, Choi SK et al (2010) Geological and geotechnical aspects of underground coal mining methods within Australia. Environmental Earth Sciences 60(5):1007–1019. doi:10.1007/s1266500902396 CrossRef 41. Sokman K, Kattai V, Vaher R, Systra YJ (2008) Influence of tectonic dislocations on oil shale mining in the Estonia deposit. Oil Shale 25(2):175–187 CrossRef 42. Systra YJ, Sokman K, Kattai V, Vaher R (2007) Tectonic dislocations of the Estonian kukersite deposit and their influence on oil shale quality and quantity. In: 15th MAEGS meeting 16–20 Sep 2007, Tallinn, Estonia. Abstracts. pp 74–76 43. Taylor JR (1982) An introduction to error analysis. In: Commins ED (ed) The study of uncertainties in physical measurements. University Science Books, California, p 272 44. Tousignant ME, Pellerin S, Brisson J (2010) The relative impact of human disturbances on the vegetation of a large wetland complex. Wetlands 30(2):333–344. doi:10.1007/s1315701000199 CrossRef 45. Tutorial for digital mapping for Estonia geology (2008) Land Board (in Estonian) 46. Undusk V (1998) Safety factor of pillars. Oil Shale 15(2):157–164 47. Valgma I (2003) Estonian oil shale resources calculated by GIS method. Oil Shale 20(3):404–411 48. Valgma I (2009) Oil Shale miningrelated research in Estonia. Oil Shale 26(4):150–445 CrossRef 49. Valgma I, Kattel T (2005) Low depth mining in Estonian oil shale depositAbbau von Ölschiefer in Estland. In: Kolloquium Schacht, Strecke und Tunnel 2005: 14. und 15. April 2005, Freiberg/Sachsen: Kolloquium Schacht, Strecke und Tunnel 2005: 14 und 15. April 2005, Freiberg/Sachsen. Freiberg: TU Bergakademie, 213–223 50. Valgma I, Reinsalu E, Sabanov S, Karu V (2010) Quality control of oil shale production in Estonian mines. Oil Shale 27(3):239–249 CrossRef 51. Väli E, Valgma I, Reinsalu E (2008) Usage of Estonian oil shale. Oil Shale 25(2S):101– 114 CrossRef 52. Wu Q, Liu S (2011) The classification of mine environmental geology problems in China. Environ Earth Sci 64(6):1505–1511. doi:10.1007/s1266501005039 CrossRef About this Article Continue reading... To view the rest of this content please follow the download PDF link above. Over 8.5 million scientific documents at your fingertips © Springer International Publishing AG, Part of Springer Science+Business Media View publication stats
txt: See discussions, stats, and author profiles for this publication at: https://www.researchgate.net/publication/236005585 Possibilities of oil shale mining under the Selisoo mire of the Estonia oil shale deposit Article in Environmental Earth Sciences · December 2013 DOI: 10.1007/s12665-013-2396-x CITATIONS 17 READS 98 5 authors, including: Some of the authors of this publication are also working on these related projects: Rikastamine View project Vivika Väizene Tallinn University of Technology 91 PUBLICATIONS 250 CITATIONS SEE PROFILE Juri-Rivaldo Pastarus Tallinn University of Technology 36 PUBLICATIONS 61 CITATIONS SEE PROFILE Ylo also Ülo also in Russian Юло Joann Systr… Tallinn University of Technology 15 PUBLICATIONS 45 CITATIONS SEE PROFILE Ingo Valgma Tallinn University of Technology 404 PUBLICATIONS 1,503 CITATIONS SEE PROFILE All content following this page was uploaded by Ingo Valgma on 11 March 2015. The user has requested enhancement of the downloaded file. All in-text references underlined in blue are added to the original document and are linked to publications on ResearchGate, letting you access and read them immediately. Look Inside Get Access Find out how to access previewonly content Environmental Earth Sciences December 2013, Volume 70, Issue 7, pp 33113321 Date: 27 Mar 2013 Possibilities of oil shale mining under the Selisoo mire of the Estonia oil shale deposit Abstract The paper presents results of the study on oil shale mining (Estonia underground mine) possibilities under the Selisoo mire. The Selisoo area is 2,051 ha in extent, and most of the mire is in natural state. Peat layer consists of thick (4.4–6.5 m) oligotrophic peat. Mining under Selisoo will go at depths 65– 70 m under the surface. The mining field of the Estonia mine was planned between Ahtme and Viivikonna fault zones. The lowest hydraulic conductivity of carbonate rocks 0.11 l/day per m2 is found in the Oandu layer and for peat it is 0.35–0.0002 m/day. Therefore, together they form a good aquitard. When the annual rainfall amount is the highest, the difference between horizontal water inflow and runoff is positive with 127,000 m3 . Positive water balance is guaranteed in case of precipitation being at least 540 mm/year. The positive water balance is important for preserving the ecological system of Selisoo mire. For guaranteeing longterm stability of mine pillars, a new calculation method has been elaborated, based on the conventional calculation scheme, where the factor of safety is more than 2.3. Rheological processes are out of question, collapse of the pillars is impossible. Stability of the underground constructions and overburden rocks must be “eternal”. The criteria were elaborated for oil shale mining and will guarantee preservation of mires in natural or close to natural state. Article Metrics Citations 5 Social Shares References (52) 1. Botch MS, Masing VV (1979) Ecosystems of USSR. Nauka, Leningrad. [in Russian] 2. Fetter CW (1994) Applied hydrogeology, 3rd edn. Macmillan College Publishing Company, Inc, New York, Library of Congress CataloginginPublication Data, pp 1– 691 3. Hints L (1997) Aseri Stage Lasnamägi Stage Uhaku Stage Kukruse Stage Haljala Stage. In: Raukas A, Teedumäe A (eds) Geology and mineral resources of Estonia. Estonian Academy Publishers, Tallinn, pp 66–72 4. Hints L, Meidla T (1997) Keila Stage Oandu Stage Rakvere Stage Nabala Stage. In: Teedumäe A, Raukas A (eds) Geology and mineral resources of Estonia. Estonian Academy Publishers, Tallinn, pp 74–81 5. Huang S, Li X, Wang Y (2012) A new model of geoenvironmental impact assessment of mining: a multiplecriteria assessment method integrating FuzzyAHP with fuzzy synthetic ranking. Environ Earth Sci 66(1):275–284. doi:10.1007/s126650111237z CrossRef 6. Ivanov KE (1975) Water exchange in peatlands. Gidrometeoizdat, Leningrad, pp 86–91 [in Russian] 7. Joosten H, Clark D (2002) Wise use of mires and peatlands. International Mire Conservation Group, International Peat Society, Saarijärvi, p 303 8. Jõgar P (1983) Groundwater flow models of Pandivere Upland (northeast Estonia). In: Proceedings of academy of sciences of ESSR. Geology 32, 2, 69–78 [In Russian, summary in English] 9. Karu V, Västrik A, Anepaio A, Väizene V, Adamson A, Valgma I (2008) Future of oil shale mining technology in Estonia. Oil Shale 25(2S):125–134 CrossRef 10. Kattai V, Vingisaar P (1980) Structure of the Ahtme tectonic disturbance. In: Proceeding of the academy of sciences ESSR. Geology 29, 2, 55–62 [In Russian, summary in English abstract] 11. Ketcheson SJ, Price JS (2011) The impact of peatland restoration on the site hydrology of an abandoned blockcut bog. Wetlands 31(6):1263–1274. doi:10.1007/s13157011 02410 CrossRef 12. Kink H (1997) Karst and springs. In: Teedumäe A, Raukas A (eds) Geology and mineral resources of Estonia. Estonian Academy Publishers, Tallinn, pp 389–390 13. Koitmets K, Reinsalu E, Valgma I (2003) Precision of oil shale energy rating and oil shale resources. Oil Shale 20(1):15–24 14. Loopmann A (1996) Formation, development and perishing of mire massis. Development of mires and formation of bedpool complex. J Estonian Peat 3(4):18–21 [in Estonian, with English summary] 15. Lu W, Luo Y, Chen M et al (2012) An introduction to Chinese safety regulations for blasting vibration. Environ Earth Sci 67(7):1951–1959. doi:10.1007/s1266501216369 CrossRef 16. Mininglaw and legal regulation acts (1998) Ministry of Environment, Ministry of Economy. Part II, Tallinn, (in Estonian) 17. Nestor H, Soesoo A, Linna A, Hints O, Nõlvak J (2007) Ordovician in Estonia and southern Finland. MTÜ GEOGuide Baltoscandia, Tallinn, pp 1–32 18. Niinemets E, Pensa M, Charman D (2011) Analysis of fossil testate amoebae along the hummocklawnhollow gradient in Selisoo Bog, Estonia: local variability and implications for palaeoecological reconstructions in peatlands. Boreas 40:367–378 19. Orru H, Orru M (2006) Sources and distribution of trace elements in Estonian peat. Symposium on peatlands—basin evolution and depository of records on global environmental and climatic changes location: Florence, Italy. Glob Planet Change 53(4):249–258. doi:10.1016/j.gloplacha.2006.03.007 CrossRef 20. Orru M (1975) Report of explorationinvestigation works of peat deposits in KohtlaJärve County. Manuscript at depository of manuscript reports of geological survey of Estonia. Geological survey of Estonia, Tallinn (in Estonian, with Russian summary) 21. Orru M (1995) Estonian mires. Geological Survey of Estonia, Tallinn (in Estonian, with English summary) 22. Orru M (2010) Dependence of Estonian Peat deposit properties on landscape types and feeding conditions. PhD thesis, Publication of Tallinn University of Technology, Tallinn, pp 121 23. Orru M, Lelgus M (2003) Peat resources investigation of Soosaare peatland in Viljandi County, the Geological Survey of Estonia, Tallinn, pp 33 24. Orru M, Orru H (2008) Sustainable use of Estonian peat reserves and environmental challenges 15th Meeting of the AssociationofEuropeanGeologicalSocieties location: Tallinn, Estonia Date: Sep 16–20. Estonian J Earth Sci 57(2):87–93. doi:10.3176/earth.2008.2.04 CrossRef 25. Orru M, Uebner M, Orru H (2011) Chemical properties of peat in three peatlands with balneological potential in Estonia. Estonian J Earth Sci 60(1):43–49. doi:10.3176/earth.2011.1.04 CrossRef 26. Parker I (1993) Mine pillar design in 1993: computers have become the opiate of the mining engineers. Mining engineering, 1993, July and August, 714–717 and 1047–1050 27. Pastarus JR (2005) Improved underground mining design method for Estonian oil shale deposit. 5th international scientific and practical conference on environment, technology and resources. Latvia, Rezekne, pp 270–274 28. Pastarus JR, Sabanov S (2005) Concept of risk assessment for Estonian oil shale mines. In: Proceedings of the 5th international conference “environment technology resources”, Rezekne Augstskolas Izdevnieciba, Rezekne, Latvia, June 16–18, 2005, 237–242 29. Pastarus JR, Toomik A (2001) Roof and pillar stability prognosis in Estonian oil shale mines. Rock Mechanics. In: Särkka P, Eloranta P (eds) Proceedings of the ISRM Regional Symposium EUROCK 2001 “Rock Mechanics a challenge for society”. A.A.Balkema/Lisse/Abingdon/Exton (PA)/Tokyo, Espoo, 849–853 30. Pastarus YR, Nikitin O (2003) Estimation methods for stability of mining excavations (on the example of shale oil deposit in Estonia). Gornyj Zhurnal Ruda i Metally 4–5:71– 75 (in Russian) 31. Peat Handbook 1982. Nedra, Moscow, 753 (in Russian) 32. Perens R (2005) Groundwater stand in 1999–2003. Geological Survey of Estonia, Tallinn (in Estonian) 33. Perens R, Vallner L (1997) Waterbearing formation. In: Teedumäe A, Raukas A (eds) Geology and mineral resources of Estonia. Estonian Academy Publishers, Tallinn, pp 163–177 34. Puura V, Vaher R (1997) Tectonics. In: Raukas A, Teedumäe A (eds) Geology and mineral resources of Estonia. Estonian Academy Publishers, Tallinn, pp 163–177 35. Reinsalu E (2001) Post technological processes in mined out areas. Estonian Science Foundation, Grant No. 3403, Tallinn (in Estonian) 36. Reinsalu E, Valgma I (2007) Oil shale resources for oil production. Oil Shale 24:9–14 37. Riet K (1974) About transmission capacity of Ordovician carbonate rock in the Estonia oil shale deposit. In: Proceeding of the academy of sciences ESSR. Chemistry. Geology 23, 3, 274–277 38. Regulation to room, pillars and safety zones calculation methods for underground oil shale mining (1997). Tallinn, pp 28 (in Estonian) 39. Sabanov S, Tohver T, Väli E, Nikitin O, Pastarus JR (2008) Geological aspects of risk management in oil shale mining. Oil Shale 25(2):145–152 CrossRef 40. Scott B, Ranjtih PG, Choi SK et al (2010) Geological and geotechnical aspects of underground coal mining methods within Australia. Environmental Earth Sciences 60(5):1007–1019. doi:10.1007/s1266500902396 CrossRef 41. Sokman K, Kattai V, Vaher R, Systra YJ (2008) Influence of tectonic dislocations on oil shale mining in the Estonia deposit. Oil Shale 25(2):175–187 CrossRef 42. Systra YJ, Sokman K, Kattai V, Vaher R (2007) Tectonic dislocations of the Estonian kukersite deposit and their influence on oil shale quality and quantity. In: 15th MAEGS meeting 16–20 Sep 2007, Tallinn, Estonia. Abstracts. pp 74–76 43. Taylor JR (1982) An introduction to error analysis. In: Commins ED (ed) The study of uncertainties in physical measurements. University Science Books, California, p 272 44. Tousignant ME, Pellerin S, Brisson J (2010) The relative impact of human disturbances on the vegetation of a large wetland complex. Wetlands 30(2):333–344. doi:10.1007/s1315701000199 CrossRef 45. Tutorial for digital mapping for Estonia geology (2008) Land Board (in Estonian) 46. Undusk V (1998) Safety factor of pillars. Oil Shale 15(2):157–164 47. Valgma I (2003) Estonian oil shale resources calculated by GIS method. Oil Shale 20(3):404–411 48. Valgma I (2009) Oil Shale miningrelated research in Estonia. Oil Shale 26(4):150–445 CrossRef 49. Valgma I, Kattel T (2005) Low depth mining in Estonian oil shale depositAbbau von Ölschiefer in Estland. In: Kolloquium Schacht, Strecke und Tunnel 2005: 14. und 15. April 2005, Freiberg/Sachsen: Kolloquium Schacht, Strecke und Tunnel 2005: 14 und 15. April 2005, Freiberg/Sachsen. Freiberg: TU Bergakademie, 213–223 50. Valgma I, Reinsalu E, Sabanov S, Karu V (2010) Quality control of oil shale production in Estonian mines. Oil Shale 27(3):239–249 CrossRef 51. Väli E, Valgma I, Reinsalu E (2008) Usage of Estonian oil shale. Oil Shale 25(2S):101– 114 CrossRef 52. Wu Q, Liu S (2011) The classification of mine environmental geology problems in China. Environ Earth Sci 64(6):1505–1511. doi:10.1007/s1266501005039 CrossRef About this Article Continue reading... To view the rest of this content please follow the download PDF link above. Over 8.5 million scientific documents at your fingertips © Springer International Publishing AG, Part of Springer Science+Business Media View publication stats

Analysis of water removal parameters in mining sites
Paper: Analysis of water removal parameters in mining sites

The future of oil shale mining
Paper: The future of oil shale mining related to the mining and hydrogeological conditions in the Estonian deposit


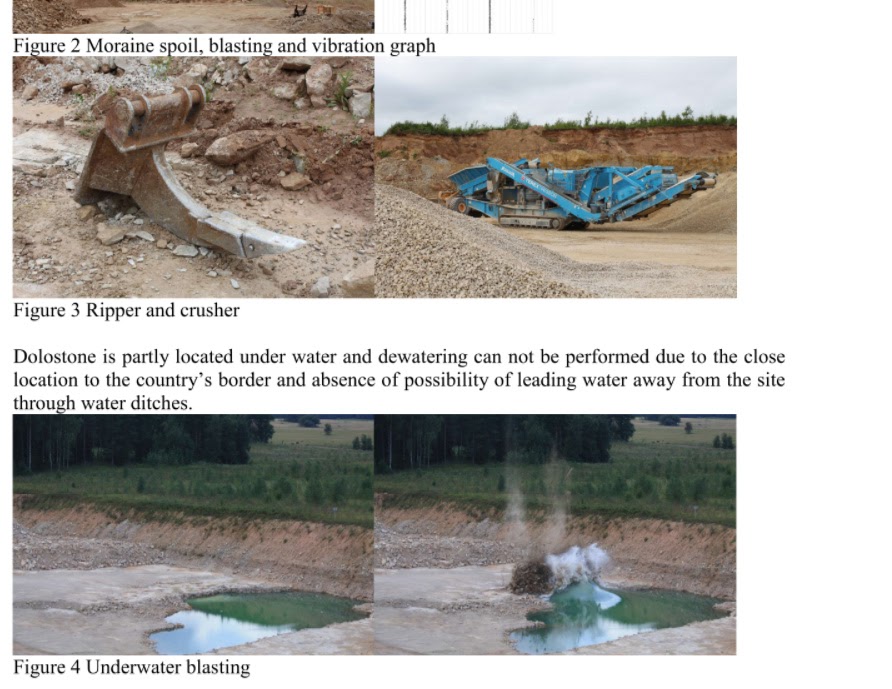
Mine water and dewatering of mining
Mine water and dewatering of oil shale, limestone and phosphate rock mining in Estonia 
Water Quality in Maardu Phosphate Rock Mining Area in Estonia
Paper: Water Quality in Maardu Phosphate Rock Mining Area in Estonia
Paper: Technologies for Decreasing Mining Losses
txt: Environmental and Climate Technologies _________________________________________________________________________________________________2013 / 11 41 doi: 10.2478/rtuect-2013-0006 Technologies for Decreasing Mining Losses Ingo Valgma , Vivika Väizene1 , Margit Kolats1 Tallinn University of Technology Abstract - In case of stratified deposits like oil shale deposit in Estonia, mining losses depend on mining technologies. Current research focuses on extraction and separation possibilities of mineral resources. Selective mining, selective crushing and separation tests have been performed, showing possibilities of decreasing mining losses. Rock crushing and screening process simulations were used for optimizing rock fractions. In addition mine backfilling, fine separation, and optimized drilling and blasting have been analyzed. All tested methods show potential and depend on mineral usage. Usage in addition depends on the utilization technology. The questions like stability of the material flow and influences of the quality fluctuations to the final yield are raised. Keywords – oil shale, losses, mining, extraction. I. INTRODUCTION In case of stratified deposits like oil shale deposit in Estonia, mining losses depend on mining technologies. Stratified deposits are being developed from lower bedding depth to deeper and more complicated conditions [23]. Continuously the environmental or social restrictions require increasing coefficients that increase mineral losses [20]. This could be limited with the help of technological development [34,13, 36]. During the period starting from 1916 many technologies have been used and tested [31]. Currently the market economy is the main driving force for choosing technologies. This causes short term choices and works against sustainability. Current research focuses on extraction and separation possibilities of oil shale. Selective mining, selective crushing and separation tests have been performed, showing possibilities of decreasing mining losses. Rock crushing and screening process simulations were used for optimizing fractions. In addition mine backfilling, fine separation of oil shale, and optimized drilling and blasting have been analyzed. All tested methods show potential and depend on mineral usage [37]. Usage also depends on the utilization technology. Questions like stability of the material flow and influences of the quality fluctuations to the final yield are raised. Tonnage, calorific value and size distribution of the product form the quality indicators [43]. Avoiding losses in any of these processes decreases mining losses and has a positive effect on resource usage and sustainability. In addition, decreasing losses increases the amount of resource and sustainability of energy supply for the country [30, 32]. If optimized technology allows maintaining required productivity, it could be applied, even if fitting into the existing technological structure is taking longer than technically available [33, 35, 8]. The aim of the current study is to clarify what technical solutions could be applied for decreasing oil shale mining related losses. II.ANALYSES AND TESTS A. Selective mining Selective extraction of oil shale seam was analyzed to understand following methods: 1. Cutting with bulldozer and excavator rippers 2. Cutting with surface miners 3. Cutting with longwall miners 4. Cutting with shortwall miners. a) Cutting with rippers Selective extraction of the oil shale seam can be done by a bulldozer ripper or hydraulic excavator ripper. Ripping is a low-selective technology [42]. In deeper surface mining areas, 100 tonnes class bulldozers were used and in more weathered areas or partial ripping zones, the 60 tonne class was used. One disadvantage of bulldozer ripping is excessive crushing of oil shale by heavy bulldozers with crawlers [18]. b) Cutting with surface miners Tests with surface miners Vermeer T1255 and Wirtgen 2500 SM were carried out. The tests were followed after longer period tests with smaller class surface miners during the last 25 years. Tests have been performed with different oil shale and limestone layers. Surface miners are considered as BAT (Best Available Technology) for surface oil shale mining extraction [12, 42, 18, 15, 5]. c) Cutting with longwall miners The planning and testing has been done for longwall mining possibilities. Shearers were used and tested for 30 years in five oil shale mines in Estonia [1]. Longwall technology has also been chosen as one of the alternatives for phosphate rock mining [41]. Technologically, this technological solution has improved compared with initial possibilities. Since the hydraulic support system was limiting the height of the longwall face (1,5 m) and the power of the shearers was relatively low (210 kW) the losses have been 50% in longwall section. Today’s sharers utilize power in the range of 2200 kW, which is 10 times higher than in the tested units. Since the productivity (equal to income) could be increased, longwall technology is one of the possibilities for lowering losses. In case of removing protective side pillars between longwall section, rough estimation shows, that losses could be lowered down to 5% taking into account the geological dislocations and disfollowing the exact horizontal plane of the oil shale seam. The main obstacle of longwall shearing Brought to you by | Tallinn Technical Authenticated | 193.40.249.178 Download Date | 10/17/13 10:07 AM Environmental and Climate Technologies 2013 / 11_________________________________________________________________________________________________ 42 technology is solving environmental and social questions, regarding subsiding the ground and accepting certain areas where such subsiding could be allowed. In comparison to the surface mining stripping in the open cast mining areas, longwall mining could be considered as a technology which causes less impact to the landscape. The ground would be lowered by up to 70% of the created space. That makes 2 meters. In open casts, even the fluctuations in the leveled overburden spoil could be 5 meters. In trench or ditches areas, the level fluctuations are up to 40 meters. This makes longwall mining the most sustainable mining method for oil shale. d) Cutting with shortwall miners Evaluations of breakability have been made with roadheaders F2 and 4PP-3. As a recommendation, a doubledrum road header was proposed. Currently the power of the machines has increased and pick properties allow cutting harder rock. It is proposed, that both longitudinal or transverse head continuous miners (roadheaders) could be used for cutting oil shale [12]. The selectivity option is directly related to the waste material handling and should be tested in the mine [11]. Shortwall miner utilization could be the solution for making development entrances, drifts and rooms for mining. In case of satisfactory cutting performance, it could be used for extracting oil shale in production sections as well. The tests have shown, that shortwall mining is a promising technology and requires, as with longwall mining, surface miner mining and axle bucket crushing changes in some operations and processes in mining technology. Shortwall mining requires fast roof supporting technology. The supporting could be in addition in some extent easer because of lower possible fragmentation of rock caused by absence of blasting in the mine. B. Selective crushing For selective crushing, the following methods were tested: 1. crushing in a drum (Bradford drum) with help of rock falling impact and hammer crusher inside the drum; 2. impact crusher in underground sections as first stage crusher or impact crusher for aggregate production from oil shale waste rock; 3. axle crusher buckets with cutting and skimming process. An impact crusher has been used in underground sections as a first stage crusher and for aggregate production from oil shale waste rock that is limestone [27]. The purpose of underground crushing is to reduce ROM (run of mine) size to the required size of up to 300 mm for transporting it on belt conveyors to the surface. C. Separation Separation tests have been performed by jigging and cycloning. The purpose was to find out the percentage of the fine material that could be separated. Jigging tests have shown relatively good results allowing separating initially mixed material into five different fractions. The calorific value of best fraction is highest and the limestone fraction in opposition should be considered as the ready selected material for limestone aggregate. Up to now the main focus has been mechanical experimenting with jig. The main obstacle of the technology could be achieving required productivity. It is similar to the filter press technology where the productivity of the single unit could be low. On the other hand, if the production line could be completed with different stages, the required productivity could also be to some extent lower. To decrease required machine productivity for the same output, drum crushing or axle crushing could be used prior to the jigging. Cycloning has shown that the calorific value of cycloned and non- cycloned fine material has no remarkable difference. Since cycloning could be done on many variations, the initial test could be considered as failed because of short time and no variations. These tests should be continued, preferably with apilot unit or laboratory units at first. D. Rock crushing For crushing, the following options have been analysed: 1. Crushing with sizers 2. Crushing with impact crushers 3. Crushing with double drum crushers 4. Crushing with drum crusher 5. Crushing with jaw crusher. Crushing process simulations were used to evaluate the distribution curves of the final product. The necessary data for this purpose is bulk density of material and the maximum size of the particles going for crushing. In order to get optimal results on certain cases, crushing units, crushers and mobile crushers can be added to the scheme. This gives extra value in lowering engineering costs, on experimenting with different devices and on further changes [19, 45]. As an example, material data for thesimulation program has been: Input material < 1000 mm Solid density 1,84 t/m3 Crushability 85% - which is the maximum Productivity 1000 t/h Gravel 31% - does not influence the results (Fig. 1.). The value of abrasiveness has been between 0,1…1500 g/t, calculations show that this does not affect the simulation results. Neither does moisture. The crusher output cavity is set on 180mm which means that the maximum size of the outcoming particle is 200mm. The workload of the impactor crusher is 97% of the maximum capacity. After crushing, the feed moves to the roller screen, where the feed flows into three classes: 0…25 mm 22,8% 12…107 mm 55,2% - which include 11% 12…25 mm (Fig.2.) 107…200 mm 22% . It can be detected that the fines part is 28,9%. Brought to you by | Tallinn Technical Authenticated | 193.40.249.178 Download Date | 10/17/13 10:07 AM Environmental and Climate Technologies _________________________________________________________________________________________________2013 / 11 43 Fig. 1. Material data insertion window Fig. 2. Flow data Fines are added on the secondary crushing/particle size is 107...200 mm. Calculations have shown that in this way 5% of fines are added. At the present moment the best crushing option in making the minimum fines is crushing with the sizer. Experiments show that the minimum in generating fines is achieved when the rotating speed of sizer was 175 rpm. In slow rotation the generation was 11,8% and fast rotation gave 6,5% of fines (Fig.3). As experiments show, it is possible to decrease the fines generation which mostly is considered to be waste. Each simulation manufacturer focuses on separation methods or some part in the separation process. When it comes to crushers, then simulations are also manufacturer based and reflect types and models, what the company offers [7, 4]. Newer products are introduced in the simulation programmes later. In case of the roll crusher for example, the characteristics and behaviours are still added to the programme. Sizers are even more complex, because they have been used only a few years and therefore are relatively new products among crushers. In Estonia there are a lot of questions concerning the fines in the crushing process. Fig. 1. Experiments resulted in fines generation of 2,2% [10] E. screening Two basic screening solutions have been analysed in addition to the traditional vibration screening: 1. Screening in drum screen 2. Screening on rotary screen 3. Screening on roller screen. F. Mine backfilling The tests contained testing of mixes properties of the backfill material, testing of backfilling technology and analyzing backfilling material flows. The main hypotheses are that backfilling reduces mining losses and the amount of waste on the ground surface [27]. In addition it increases land stability [12]. Stability issues have been developed in sense of information availability. Mapping, special information systems and seismological methods allow one to detect any collapses which have occured [21, 25]. G. Fine separation Fine separation tests were carried out with CDE equipment and with jigging equipment. The aim of the fine separation test is to separate fines from pulp before they reach sedimentation pond and to take it into use as a product. III. RESULTS AND DISCUSSION A. Selective mining a) Cutting with rippers In Ubja oil shale open cast, the productivity of oil shale hydraulic ripping was nearly 600 m3/h. At the Ubja open cast, overall oil shale losses are 0% based on the Environmental Register. Bulldozer ripping is considered as semi-selective ripping where seam losses make 12% in comparison to 5% with surface miners [42]. The first problem of ripping technology has been power of ripping machines. Before 100 tonnes class bulldozers were applied, the low ripping power was one of the main concerns. Excavator ripping is in similar stage like bulldozer ripping has been in its beginning stage. The power of the excavator ripper is not satisfactory to reach required productivity. Excavator ripping does not solve the losses question because of the principle of vertical movement. Brought to you by | Tallinn Technical Authenticated | 193.40.249.178 Download Date | 10/17/13 10:07 AM Environmental and Climate Technologies 2013 / 11_________________________________________________________________________________________________ 44 Excavator ripping could be considered in low bedding areas, where drilling and blasting is prohibited, the oil shale seam is weathered meaning weaker bonds between layers. A bulldozer ripper, therefore could be used as low selective miner, but it is limited by availability of keeping losses down. The main problem is limestone and oil shale pieces and lumps that contain both material and could not be separated by the ripper. If needed, one of the solutions could be skimming with axle crushers. b) Cutting with surface miners It was found that extracting with a high selective surface miner is the main possibility of decreasing losses in case of surface mining. The main obstacle for using such technology is the partly unsolved overburden stripping technology. In the future, combined methods should be considered like high selective cutting plus selective axle crushing for aggregate separation. Mining with surface miner Wirtgen 2500 SM helps to reduce losses and improve calorific value of oil shale. It is possible to mine limestone and oil shale seams separately with higher accuracy than rippers (2-7 cm) with deviations about one centimetre [42]. Losses can be decreased from 12 percent to 5 percent compared to ripping [18]. Based on practical data, the surface miner enables to increase the output of oil shale up to 1 tonne per square meter. The oil yield increases 30%, reaching up to 1 barrel per tonne of oil shale during the oil shale retorting, because of better quality, meaning higher calorific value of the material that is sent to the retorts [42]. c) Cutting with longwall miners It was found that distribution of required large particles of oil shale is possible with longwall shearers. The practice with longwall shearers shows that the subject for cutting is oil shale and the larger size is distributed to the limestone fraction [1]. This is due to the hardness difference of the rocks. Longwall mining could decrease horizontal losses by 20 to 40%. d) Cutting with shortwall miners One of the main advantages that a shortwall miner could present are the possibility of avoiding weakening pillars in the mine by blasting [20]. This in addition could give the possibility to decrease pillar size and to decrease losses left to the pillars. Pillar losses that are caused by pillars with cross section area of 16 to 49 square meters could be decreased therefore by 16 to 28% with avoidance of the 0,3 zone by sides of the pillars. The pillas strength and stability of the ground are directly related but have the opposite influence on sustainability. In case of backfilling this dilemma could be solved [22]. In some areas also smooth and directed subsidence could be solution. B. Selective crushing The underground crushing process where ROM (run of mine) size is reduced to the required size up to 300 mm has no direct influence on the percentage of losses. Nevertheless, ROM size distribution is influenced by impact crushing and fines are produced. In case of oil production with vertical generators, fines and small classes of oil shale are considered as waste, if no other uses are found, like cement, electricity or oil production with SHC technology. Selective crushing is important both for cleaning and sizing oil shale and cleaning and sizing limestone. Therefore selective crushing or selective mining methods are recommended [27]. C. Rock crushing a) Crushing with sizers One of the options could be using slow rotating or optimized rotating sizer for oil shale ROM crushing. According to the recommendations of crusher producers, all crusher types are suitable for crushing oil shale [25]. In relation to the moisture content, jaw crusher and gyratory crushers are unsuitable, requiring relatively dry material (
Influence of water discharging on water balance and quality in the Toolse river in Ubja oil shale mining region
Paper: Influence of water discharging on water balance and quality in the Toolse river in Ubja oil shale mining region

Oil Shale mining-related research in Estonia
txt: Oil Shale, 2009, Vol. 26, No. 4, pp. 445–450 ISSN 0208-189X doi: 10.3176/oil.2009.4.01 © 2009 Estonian Academy Publishers EDITOR’S PAGE OIL SHALE MINING-RELATED RESEARCH IN ESTONIA Finally the long-announced changes arrived, caused by environmental, geological and technological changes in oil shale mining sector. In addition, the biggest change has occurred with alteration of professionals’ generation. In most of the countries, the institutions dealing with mining are facing difficult questions – to continue or not to continue, and if, then how. Research, development and teaching work are facing a low at the moment. The biggest section in oil shale business in which saving and effectiveness could be achieved is the mining sector. It includes social and environmental restrictions in deposits, losses in pillars and separation of products and waste rock. Losses are closely related to backfilling and waste rock usage. Much smaller sections include production of oil, electricity and chemicals in which most of the research and development is performed today. Efficiency of oil shale usage depends manly on mining technology. 446 Editor’s Page Current urgent topics for investigating, testing and developing of oil shale mining related questions are backfilling, mechanical extracting of shale and digital modelling of mining processes. Estonian oil shale mining industry with its 90 years of history has been a test polygon for equipment manufacturers, geologists and mining engineers from Germany, Soviet Union, Finland and Sweden. These are the reasons why Estonia has recently hosted in average one international mining-related conference per year and is going to host the most important and highest level of the conferences – Annual General Meeting of the Society of Mining Professors “Innovation in Mining” (SOMP AGM 2010, http://mi.ttu.ee/somp2010). Mining research concerning Estonian oil shale deposits Several mining-related factors, such as changes in environment, underground conditions, landscape and property, tend to awoke public resistance. In order to create sustainable mining conditions, research on the natural environment and experiments conducted in mines and mined areas are required. Together with physical experiments, computer modelling is a widespread method in mining engineering. The principal task of modelling is to choose criteria and constraints satisfying all involved parties, as well as ways of presenting. In reaction to this, various restrictions for mining (mainly environmental ones) are created. In most cases, their argumentation is onesided, often subjective. As a result, it is not possible to exploit a large part of deposits due to environmental restrictions, but also due to expiration of evaluation criteria of the supplies of resources. Part of the problems is caused by miners that do not apply environmentally friendly mining technologies. Mining environment is understood as the entity including resources (deposits and groundwater), land (agricultural and housing land), engineering and technology. Research has shown that ground and landscapes changed by mining can afterwards be of better quality than before. If reclaiming is planned skilfully, the soil, landforms, forest, water bodies and agricultural land can be more valuable than before mining. All this is the basis for developing acceptable, environmentally friendly mining. Acceptable mining requires engineering research concerning both natural and technogenic environment, e.g. modelling and pilot projects. As such research is voluminous, computer modelling has become the principal tool in solving problems related to all sorts of developments, technologies and effects. The key issue is defining criteria and restrictions that satisfy all the involved parties. Creating models and estimation criteria requires miningrelated expertise and a database acquired from measurements, experimenting and laboratory testing. Modelling is followed by laboratory and industrial experiments, which require profound know-how. The experiments include e.g. chronometry of technological productivity, geometric and geological measurements, and measurements of rock quality. The parties that compose mining plans, development plans and estimations of environmental effects Editor’s Page 447 have acquired planning and modelling software for various purposes, which causes some problems: the geological database requires skilful treatment; data exist in several geodetic coordinate systems and include partly obsolete stratigraphic terminology. Unfitting coordinate systems disturb the usage of cross-use of spatial data in various geoinformation databases (digital maps, border files, land registers, building registers, databases of technological networks of enterprises, etc.). This creates further problems related to mined areas. Most environmental restrictions, which have to be taken into account in mining and building, are not based on real measurements. Usually the restrictions are two-dimensional and do not take into account the structures of the geological environment. Such vagueness does not support precise engineering calculations or modelling. Basic modelling systems that are designed in developed mining countries are principally meant for deep deposits. However, in Estonia there are blanket deposits, which cause wider environmental effect of mining. Because of that, imported systems have to be adapted. Mining is possible in any circumstances, provided that sustainable mining environment has been created. In other words, with the proper choice of mining technology, the effect of mining has been damped below the level that the nature and man can tolerate. The methodology and criteria for planning, designing, modelling and accepting of sustainable mining environment will provide the basis for mineral raw material that the economy requires, both in the near and far future. The principal direction of developing mining technology is filling the mined area. This provides control over majority of environmental effects. For instance, filling the workings decreases the loss of resources and land subsidence, and at the same time provides usage for stockpiling. Filling the berms of surface mine decreases dewatering; harmless waste can be used for filling open mines and in this manner offer new building land. Local land subsidence related to mining may extend also to technological networks. It is possible to find out deformation parameters by geodetic monitoring. Taking these parameters into account enables to model further the extent and effect of the deformation. Modelling, including digital planning, is aimed at gaining and creating the following: mining indicators needed for making decisions, future scenarios of mining oil shale and building material, support for development planning at state and regional level, technological solutions that take into account all possible environmental effects and social reactions, new output: project solutions, theme maps, inquiries, zoning, evaluations of crises or risks, optimal methodology for gaining, storing and using information, having in mine requirements for various purposes and levels, more effective usage of geological, technological and spatial information, additional functionality of the database. The optimal solution is obtained by modelling. The most general but also dominant criteria are: minimal effect on man and nature, minimal amount of 448 Editor’s Page residual and waste, maximal economic profit, also in other fields not only in the mining industry. The problem includes several criteria, and its solving requires both theoretical and computational solutions. Principal methods are related to introducing sensors, measuring equipment and mining condition experiment, matching structures of various data and modelling based on them. The methods are: mapping the modelling criteria, indicators and processes of the mined areas; experimenting the possibilities of application, compatibility and results of mining software; applying laboratory experiments and fieldwork in modelling; creating models for blanket deposits (methodology in modelling MGIS, i.e. mining geoinformation system, models of new mines, changes in ground conditions, environment (modelling and analysis of groundwater dynamics, effects of dust, noise, etc.), geotechnological models in mined areas); applying seismological methods for developing theory for collapse risk, analysis methods for creating spatial models from geodetic spatial information, studies on material properties for developing theory for criteria for rock breakage, dendrochronologic studies for monitoring changes caused by collapses and changes in the water regime. As a result, conditions for creating mining environment satisfying all involved parties (industry, state, public, decision makers) will be developed, applicable for any deposit of any resource. A system of criteria of evaluating the mining environment will be designed. This research provides for mining science a new level of digital modelling of blanket deposits, basing on long-term experiments and modern digital planning. The research results will be applied in compilation of the state development plan, planning mined areas, as well as in teaching and science. The results are relevant principally for users of land and ground (builders, geologists, hydrogeologists, hydrologists, mining engineers and reclaimers). The results provide better understanding between the public and the miners, and further a basis for well-argumented communication and promotion for economy in the manner that satisfies both parties. In recent years, there has been a world-wide initiative for research, creating the concept of sustainable mining, using relevant indicators and making decisions based on them. MMSD (Mining, Minerals, and Sustainable Development), SDIMI (Sustainable Development Indicators for the Minerals Industry) and other international networks emphasize the need for creation of a concept for regional sustainable mining, relevant for local conditions. At the same time, modelling systems are being built and usage of non-traditional fuels is being started. About three decades ago oil-shale mines of the former USSR including Estonia did not use the progressive mining methods with continuous miner, which are most suitable for the case of high-strength limestone layers in oilshale bed. Therefore, oil shale mining with blasting has been used as a basic mining method in Estonian minefields up to now while continuous miner was tested for roadway driving only. As for cutting, the installed power of Editor’s Page 449 coal shearers and continuous miners has increased enormously since the original work. The actual state of the market has changed, and a wide range of powerful mining equipment from well-known manufacturers like DOSCO, EIMCO, EICKHOFF, etc. is available now. Estonia has 30 years of experience in cutting with longwall shearers which were not capable of cutting hardest limestone layer inside of the seam. Tests with road headers have been carried out in the 1970s. Additionally Wirtgen surface miners have been tested (SM2100 and SM2600) for two years as well as SM2200 and Man Tackraf surface miner, and currently the testing of Wirtgen surface miner SM2500 for high selective mining in an open cast mine is being performed. The main field to be developed in addition to mine backfilling is mechanical extraction of oil shale. Potentially this allows increasing oil yield, decreasing CO2 pollution, decreasing ash amount, decreasing oil shale losses, avoiding vibration caused by blasting, avoiding ground surface subsidence (in the case of longwall mining), increasing drifting and extracting productivity compared with current room and pillar mining, increasing safety of mining operations. The final aim of the research is to use BAT (best available technology) for underground mining in areas with arduous conditions of coal and oil-shale deposits. The main problems to be solved are: selective cutting of oil shale (15 MPa) and hard limestone (up to 100 MPa), roof support at the face, stability of the main roof, roof bolting, pillar parameters, backfilling with rock or residues (ash) from oil production, water stopping and pumping in problematic environment (30 m3 /t expected). Currently room and pillar mining with drill and blast technology is used underground. Supporting is done with bolts. Mining production is in total around 14 Mt/y, including 7 Mt/y underground. Total raw material amount underground is 12 Mt/y. Tests are made for opening new mines, with total production 15 Mt/y. Continuous miners keep playing a major role in the underground industry in over fourteen countries worldwide. Estonia’s oil-shale industry is at the beginning of introducing modern fully mechanized continuous miner systems, which could increase productivity and safety in the underground mines. A longitudinal cutting head-type miner was first introduced in the former Soviet Union by modifying the Hungarian F2 roadheaders and in the 1970s in Estonia by modifying the Russian coal roadheader 4PP-3. Evaluation of breakability was performed by a method developed by A. A. Skotchinsky Institute of Mining Engineering (St Petersburg, Russia). For this purpose over a hundred samples produced by cutting of oil shale and limestone, as well as taken in mines by mechanical cutting of oil shale were analysed. Evaluations were made for using coal-mining equipment for mining oil shale. Comparative evaluations were made by the experimental cutting of oil shale in both directions – along and across the bedding, including also mining-scale experiments with cutting heads rotating round horizontal 450 Editor’s Page (transverse heads) and vertical axes (longitudinal heads). In both cases the efficiency was estimated by power requirement for cutting. The feasibility was shown by breaking oil shale in direction of cutting across the bedding by using cutting drums on horizontal axis of rotation. The research also evidenced that the existing coal shearers proved low endurance for mining oil shale. Therefore, there arose the problem of developing special types of shearers for mining oil shale or modifying the existing coal shearers. It was further stated that the better pick penetration of the longitudinal machines allows excavation of harder strata at higher rates with lower pick consumption for an equivalent-sized transverse machine. It was reported that with the longitudinal cutting heads the dust forming per unit of time decreases due to smaller peripheral speed. The change in the magnitude of the resultant boom force reaction during a transition from arcing to lifting is relatively high for the transverse heads, depending on cutting head design. Specific energy for cutting across the bedding with longitudinal heads is 1.3–1.35 times lower which practically corresponds to the change of the factor of stratification. These are the questions waiting for answers in the near future for effective oil shale extraction in Estonia and in similar mining conditions. In spite of current economic problems, still everything begins with mining. Ingo VALGMA Head of Department of Mining of Tallinn University of Technology, Head of Estonian Mining Society, President of the Society of Mining Professors / Societät der Bergbaukunde
Developing computational groundwater monitoring and management system
Paper: Developing computational groundwater monitoring and management system for Estonian oil shale deposit

Paper: Technogenic water in closed mines
Paper: Technogenic water in closed mines  Oil Shale, 2006, Vol. 23, No. 1 ISSN 0208-189X pp. 15–28 © 2006 Estonian Academy Publishers The present paper is based on the results of the research conducted in 2004 by the Department of Mining of the Tallinn University of Technology and Estonian Oil Shale Company. The state of the technogenic water body that has formed in the central part of the oil shale deposit is analysed: the water level in the area of the stopped and closed mines, water amount and move- ment direction, water quality and its changes. The state of the water is assessed and predicted using modelling of the water tables, statistical analysis of the water quality parameters and the pilot model for describing the migration of water. The results show that the technogenic water body studied is in a relatively stable state, and the quality of the groundwater in that area is fast improving approaching the drinking water standards. Introduction The Estonia oil shale deposit comprises about ten closed and stopped deep mines that are fully or partly filled with water (Table 1). Eight mines in the central part of the deposit: Ahtme, Kohtla, Kukruse, Käva, Sompa, Tammiku and mines Nos. 2 and 4 form one water body. After Ahtme mine was filled with water in December 2004 (Fig. 1), the water body turned relatively stable. Ubja mine and joint Kiviõli and Küttejõu mine are located in the western part of the deposit, farther away from the other mines. In addi- tion to oil shale mines, Sillamäe uranium mine (1949–1952) [1], and Ülgase (1922–1938) and Maardu phosphorite mines (1942–1965) have been closed in Estonia. The water regime in these mines has not been studied yet and is not discussed in the present paper. * Table 1. Closed and flooded underground oil shale mines Mine Closed – (pumps were stopped) Mined area, km2 * Water table a.s.l., m Outflow regulating the water table Approximate water volume, 106 m3 Central part of the deposit: Kukruse 1967 13 51–54 Mostly into Käva and Jõhvi mines 3.5–6** Käva and Käva-2 1973 18 51–52 From an old adit into Vahtsepa ditch 9–11** Mine No. 2 (Jõhvi mine) 1974 13 51–56 Mostly into Tammiku mine, during flood to Jõhvi city 10–11** Mine No. 4 1975 13 41–42 Mostly into neigh bouring mines 3–8** Tammiku December 1999 40 44–48 Into the Kose River and Viru mine 34 Sompa February 2000 27 40–45 Into neighbouring mines 23 Kohtla June 2001 17 39–42 Into Aidu opencast 13 Ahtme December 2001 – December 2002 35 ≈ 47 From drill holes and springs into Sanniku brook 36 Separate mines in the western part of the deposit Kiviõli & Küttejõu 1989 29 41 ± 0.5 From a ditch into the Purtse River Up to 29 Ubja 1960 2 ≈ 55 From an adit into the Toolse River Not determined Total ≈ 170 * [5] ** Depending on the water level [6] As a rule, the mine workings and groundwater cone of depression formed during mining fill with water after the cease of mine pumping. The degree of filling depends on the mining depth and the height of outflow. The tunnels of Ahtme, Sompa and Tammiku mines are completely, those of mines Nos. 2 and 4 almost completely water-filled. The rest of the mines (Kiviõli, Kukruse and Käva) contain areas with dry floor. The museum founded in Kohtla mine is dry because of to the draining effect of Aidu opencast and the water barriers surrounding the exposition area. The water level changes depending Technogenic Water in Closed Oil Shale Mines 17 10 15 20 25 30 35 40 45 50 2002 2003 2004 2005 Water level, m Tarakuse well Pagari well Fig. 1. Increase in the water table in closed Ahtme mine on the amount of precipitation and water exchange with neighbouring mines. The rate and amplitude of the changes differ from mine to mine. Several problems have arisen from the flooding of the closed mines. First, the technogenic water body started to affect the amount of the water pumped out of the working mines and its seasonal variation [2]. Clearly, the water of the closed mines will influence also the new mines, planned to be constructed in the Ojamaa and Uus-Kiviõli mine fields. Second, the environ- ment is affected by the water that in several places has risen to the pre- mining level (of the year 1945) and by the new springs formed. Several projects have been undertaken to fight the flooding, and it has turned out that no sufficient source data for mine planning are available. Third, the water of the closed mines is an easily accessible water resource, thus it is important to know and predict its quality [3]. Prediction of the mine water quality is essential also because of the fact that groundwater elevation in the mine field has started to affect the water supply of the region – the water richer in sulphates runs into the outdated and leaky common wells. It has also been prognosticated that if the groundwater table rises higher than 45–47 m, the water in the Ahtme mine field will affect the water level and quality of the Vasavere intake [4]. Fourth, the land above old mines has subsided and the rocks are fractured, therefore the technogenic groundwater is weakly protected and the contribution of precipitation to groundwater formation is very high. Water level The present study is based on the water level measurement data (incl. archive data) provided by the Estonian Oil Shale Company, Geological Fig. 2. Map of the technogenic water body Technogenic Water in Closed Oil Shale Mines 19 Survey of Estonia and Municipality of the town of Jõhvi. The water levels of the Keila–Kukruse, Lasnamäe–Kunda and Nabala–Rakvere aquifers, closed mines and main outlets were measured on an average period of 20 years. New data were obtained in the years 2003 and 2004. Field works and monitoring started in the spring of 2004 and are still going on. An essential part of the research was the modelling of the level of the Keila–Kukruse aquifer in the stationary regime. The modelling area included the central part of the deposit – underground mines and Aidu opencast. Data from about 50 observation wells were used. The water level of working mines was described at the level of the oil shale bed floor. Closed mines were treated as independent water sub-bodies, where the water level is constant at a certain moment of time (Table 1). The MapInfo Professional software was used, combined with the modelling package Vertical Mapper. The comparison and calibration of the intermediate results obtained and discussions held showed that the best interpolation method was triangulation with smoothing, because in that case interpolation takes place only between data points or observation wells, without modelling the situation outside the study area. During the first stage of the research the state of the water body in August 2004 was assessed. According to the measurements and calculations performed, precipitation accounts for up to 70% of the water pumped out of mines [2]. The autumn–winter season of 2004 was rich in precipitation, with little snow and relatively warm. Therefore it could be expected that Ahtme mine would fill with water sooner than predicted [4]. To check that hypothesis, the model was calibrated at the second stage of the research in December 2004. The contour map of the modelled water table is shown in Fig. 2. By continuous improvement of the existing and addition of new data more than ten two- and three-dimensional map versions were completed. The model enabled us to assess the water levels in different mines and their border areas and to make assumptions and predictions about the water move- ment directions. Water quality In the years 2000–2004 the department of environmental services of the Estonian Oil Shale Company had the waters of all closed mines analysed. The samples were taken at six sites in four mines in different seasons. Analyses were made at the central laboratory of the Estonian Oil Shale Company (3 analyses), in Tartu Environmental Research Ltd. (2 analyses) and in the Geological Survey of Estonia (12 analyses). Up to 16 quality parameters were determined. The results of the analyses are presented in Table 2. The quality parameters are arranged in Table 2 in the decreasing order of the variation in measurement results. At first glance only the average contents of iron, sulphates and phenols obtained for the observation period do not meet the drinking water standards. This cannot be a final conclusion. The average Table 2. Water quality parameters in closed Ahtme, Kohtla, Sompa and Tammiku mines Quality parameter Unit Number of measurement results Numerical data for the entire period (2000–2004) Leachates Total Certain numerical values Arithmetical mean Standard deviation Variation coefficient Max. levels permitted in drinking water Total Fe mg/l 14 10* 0.69 1.16 1.67 <0.2 NO3 - mg/l 15 11* 11.7 18.55 1.58 <50 NO2 - mg/l 12 7* 0.015 0.0166 1.10 <0.5 SO4 2- mg/l 15 15 342.4 240.2 0.70 <250 Dry residue mg/l 14 14 845.5 569.6 0.67 – Mg2+ mg/l 15 15 51.6 32.58 0.63 – K+ mg/l 13 13 12.9 8.11 0.63 – Ca2+ mg/l 15 15 174.5 107.6 0.62 – Na+ mg/l 14 14 10.4 6.33 0.61 <200 Cl mg/l 15 15 16.4 9.74 0.59 <250 Total hardness mge/l 13 13 13.72 7.04 0.51 – Oil products mg/l 15 4* 0.15 0.073 0.49 <0.05 Conductivity μS/cm 14 14 1095 477.6 0.44 <2500 NH4 + mg/l 12 2* 0.017 0.0064 0.39 <0.5 Total phenols mg/l 15 4** 0.0017 0.00049 0.28 <0.0005 pH 15 15 7.1 0.33 0.05 6.5–9.5 * due to the lack of a certain numerical value the result was smaller than the preciseness of the laboratory tests, but not exceeding the limits permitted in drinking water ** due to the lack of a certain numerical value the result was smaller than the preciseness of the laboratory tests, in two cases not exceeding the limits permitted in drinking water; rest of the samples gave no unique result Notes: Quality parameters are ordered according to the variation coefficient. The shaded lines contain the measurement results the average of which does not meet the Estonian drinking water standard. The content of benzo(a)pyrene was measured in 11 samples. The results are not included in the table because no certain numerical values were obtained. In all samples the benzo(a) pyrene content was lower than the permitted maximum value. and standard deviations given in the table have been calculated for all closed mines and for the entire observation period, thus they characterize only the data set and not the quality of water or a particular mine. Variation in the measurement results is caused by influential as well as random factors. Influential factors are the sampling site (mine) and the time span that has passed since the closure of the mine. Let us treat this assumption as a working hypothesis. A random factor is the season when sampling was performed. For example, in the years 2000 and 2001 samples were taken in summer, in 2002– 2004 in autumn. Surely the water quality parameters depend also on the Technogenic Water in Closed Oil Shale Mines 21 location of the sampling site in the mine field. Some part of variations result from the methodology of sampling and laboratory tests. The reliability of iron content analyses carried out in different laboratories could be questioned. The phenol content of mine water, measured repeatedly during mining, has been 0.003 ± 0.001 mg/l, except for Kiviõli mine, which has been strongly affected by chemical industry. Here the phenol content of mine water was 0.38 mg/l [7]. For preliminary checking of the working hypothesis we conducted a two- factor (place and time) variation analysis of the sulphate and iron contents of Tammiku and Sompa mine waters. The results of sulphate analysis are given in Table 3. We can see that the hypothesis of the influence of place and time on the sulphate content of water is relatively strong (probability of a counter- hypothesis 18.0 and 18.8% respectively). The residual standard deviation (187 mg/l), however, is too large for making definite conclusions. Obviously the result is influenced by taking samples in different seasons. An analogous result was obtained by the variation analysis of the iron content, whereas the impact of time turned out to be small. Possibly this could result from the treatment of samples in different laboratories. In spite of great uncertainty of measurement, the sulphate and iron contents decrease with time. This trend is depicted by graphs in Fig. 3. As could be expected, the purification of water is best described by the exponential function. The constants in the formulae (801 and 0.77 mg/l, respectively) characterize the average concentrations at the initial moment of the dilution process (at the closure of mines) and the time factors (–0.386 and –0.507, respectively) show the rate of water purification. The half-life of the concentration calculated on the basis of time factors, i.e. the time period during which the content of a component decrease twice, is about 1.8 years for sulphates and 1.4 years for iron. From the half-life and graphs we may presume that in about five years after the closure of a mine the content of sulphates and iron decreases below the maximum permitted level in drinking water. The highest permitted content of iron in first-class drinking water is 0.2 m/l and that of sulphates 250 m/l. The data on all mines are included in the graphs of Fig. 3. The measure- ments revealed varying initial concentrations of sulphates for different mines. The highest concentration was recorded in the first sample from Ahtme mine, the lowest in Kohtla mine. Actually, this is not the initial level, since the first samples were taken 4–11 months after the pumps had been stopped. Approximating the results obtained from the samples of each mine separately, we get theoretical dilution of the initial concentration level at the zero moment, about 2200 mg/l for Ahtme and 300 mg/l for Sompa. These values refer to a relation between the depth of the mine and the initial concentration of sulphates. The hydrogeological background of this pheno- menon is discussed by Erg [3]. Table 3. Results of the variation analysis of the content of sulphates Source of Variation df MS F P-value Mines (Tammiku, Sompa) 1 91681 2.63 0.180 Years (2002–2004) 4 92788 2.66 0.183 Error 4 34924 Residual Standard Deviation 187 mg/l Total 9 SO4 2- = 801 e-0.386 t, mg/l R2 = 0.46 10 100 1000 10000 01234567 t - closed, years SO42- - sulphate content, mg/l 250 mg/l Fe = 0.77 e -0.509 t , mg/l R2 = 0.39 0.01 0.1 1 10 01234567 t - closed, years Fe content, mg/l 0.2 mg/l Fig. 3. Decrease in the content of SO4 2- and Fe in closed mines. 250 mg/l and 0.2 mg/l – maximum permitted levels in drinking water. The water quality parameters for which we had at least 14 reliable measurement results (pH, electric conductivity, total hardness, Cl- , dry Technogenic Water in Closed Oil Shale Mines 23 residue, Na+ , Ca2+, Mg2+, K+ and SO4 2- ) were subjected to correlation analysis. From the analysis we could conclude the following: • The content of sulphates can be considered a good indicator of mine water quality, because it correlates well with most of the other water quality parameters, except for K+ . • Electric conductivity can be successfully used for rapid assessment of water quality, because it correlates well with sulphates as well as with other main parameters (except for K+ ). • pH is not informative enough, because it does not correlate with any other water quality parameter. Pilot model of water exchange Continuous water exchange is going on between the closed mines. The water penetrating into mines is derived mostly from precipitation, less from groundwater. The part of the water not flowing out of the mine (Table 1) infiltrates into the neighbouring mines or feeds aquifers. The water pumped out of the working mines is formed of precipitation, groundwater and the water coming from closed mines. Intensity of water exchange depends on the length (L, km) and thickness (l, m) of the barrier left between the mines, difference between the water levels of neighbouring mines (dh, m) and permeability of the barrier and overburden (km, m2 /d). The longer and thinner is the barrier, the greater is the water level difference in neighbouring water bodies, and the higher is the permeability of rocks in the areas separating the mines, the more intensive is the exchange of water. The water levels of the closed mines are precisely known. The measure- ments of barriers can be obtained from the plan of mining works, but the length and thickness of the barriers are highly variable. Little data are available on the permeability of pillars and bedrock. As seen in Table 4, the permeability of the Keila–Kukruse aquifer differs up to 10 times within the limits of the deposit. Water permeability is largely affected by the geological disturbance of the Earth crust (mostly karst zones), which makes the aquifer highly aniso- tropic [8, 9]. In the Estonia mine field twofold difference in the permeability in the northeastern and southeastern directions has been recorded. According to the data by Domanova, anisotropy is especially great in the area of tectonic dislocations, where permeability in various directions may differ several times. Water exchange between the mines is inhibited by extensive karst zones running along the mine field boundaries between Sompa and Viru, and Ahtme and Tammiku mines. At the same time, karst zones running transversely to the mine boundary increase the water exchange between Sompa and Kohtla mines. Additionally, the water exchange is affected by the properties of the mined area, which depend on the roof handling methods used. In the area Table 4. Permeability of the Keila–Kukruse groundwater aquifer in the mining district Filtration module Publication District Permeability, m2 /d Estimated difference in water tables, m m/h m/d Kohtla – Aidu, northern part 1200 5 10 240 Kohtla – Aidu, central part 780 10 3.25 78 [8] Kohtla 6–60 Viru 10–40 [7] Aidu, generalized 393 10 1.6 39 Ahtme, generalized 335 10 1.4 34 [4] Tammiku 4–20 Ahtme 1–15 [7] Ahtme – Estonia 90 10 0.38 9 [4] No. 2 – Tammiku 0.24 6 [10] mined using roof caving the water-bearing horizon is thicker and of higher permeability than in the area of room-and-pillar mining. Because of high uncertainty the calculation of the water amounts moving between the closed mines is complicated, not only due to the variability in L, l, k, but also due to the lack of the relation uniquely describing all the situations. Therefore the present study makes use of the balance method, which unites the amounts of the water pumped out of the working mines, and of precipitation and groundwater infiltrating into the mine. The relation between these amounts is expressed by the approximate formula qij = 365.25 × Lij × kij × (dhij/2) / (1000 × lij), where qij – the amount of the water migrating from one mine (i) to the other (j), million m3 /y, Lij – length of the barrier between these mines, km, lij – average thickness of the barrier, m, dhji – difference between the water levels of two closed mines at the moment of modelling, m, kij – factor characterizing the permeability of the area between the mines (barriers and overlying rock), which, with some reservation, can be considered as generalized permeability, m2 /d. As model input we use the measurements of the barriers between the mines, volume of the water pumped out of the working mines (especially changes in it due to the closure of neighbouring mines), amount of precipita- tion and its relation to mine pumping [2]. The variable parameter of the Technogenic Water in Closed Oil Shale Mines 25 model is generalized permeability, which is used to balance the model. Permeability was fitted into the model taking into consideration the informa- tion available (Table 4), location of mines with respect to tectonic fault zones and the orientation of the karst zones lying between the mines. The balanced model can be used for calculating the migrating water amounts by fluctuations in water level, for example during floods and heavy rains, but also for planning water level regulations. The model output is the matrix of water exchange (Table 5), where • “North” denotes the northern closed mines No. 2, Kukruse, and Käva and its satellite mines • “West” denotes the western closed mines Kohtla, Sompa and No. 4 • “Vasavere” is the area east of Ahtme and Estonia mines • The water amounts in the matrix of water exchange are given in million m3 /y, whereas (+) shows the amounts infiltrating into the mine (i) from the mine (j) and (–) shows the amounts migrating from the mine (i) to the other mine. Explanations to the matrix of water exchange are given in Table 6. Water movement inside the water body and the amounts of mine pumping are shown in Fig. 1. The values presented characterize the state of the water body in the year 2004, but as we have to do with a pilot model, these are all approximate. Table 5. Matrix of water exchange, year 2004, 106 m3 /y ↓Elements of the water body → Aidu Estonia Viru Ahtme Tammiku North West Vasavere Jõhvi city Sum Working mines: Aidu 0.00 0.00 0.00 0.00 0.00 0.00 14.46 0.00 0.00 14.46 Estonia 0.00 0.00 1.64 6.48 0.00 0.00 0.00 0.48 0.00 8.60 0.00 0.00 –1.64 0.00 0.18 7.23 0.00 3.07 0.00 0.00 8.83 Technogenic water body; closed mines (sub-bodies): Ahtme 0.00 –6.48 –0.18 0.00 0.07 0.00 0.00 –1.07 0.00 –7.65 Tammiku 0.00 0.00 –7.23 –0.07 0.00 2.28 –1.69 –0.50 0.00 –7.22 North 0.00 0.00 0.00 0.00 –2.28 0.00 –4.60 0.00 –0.15 –7.03 West – 14.46 0.00 –3.07 0.00 1.69 4.60 0.00 0.00 0.00 –11.24 Geographical sites: Vasavere 0.00 –0.48 0.00 1.07 0.50 0.00 0.00 0.00 0.00 1.09 Town of Jõhvi 0.00 0.00 0.00 0.00 0.00 0.15 0.00 0.00 0.00 0.15 Table 6. Water exchange between mines Mines, techno- genic water sub-bodies and geographical sites Water exchange, 106 m3 /y Comments Working mines: Aidu 14.46 Inflow from closed Kohtla mine Estonia 8.60 Main inflow from closed Ahtme mine, less from the direction of working Viru mine, partly also from the east Viru 8.83 Inflow from closed Tammiku and Sompa mines, slight outflow into Estonia mine Technogenic water body; closed mines (sub-bodies): Ahtme –7.65 Outflow mainly into Estonia mine and into the catchment area of the Pühajõgi River through springs and outflow wells Tammiku –7.22 Intensive water exchange with other parts of the water body, out flow into the catchment area of the Pühajõgi River through a caving at Kose Northern closed mines Käva, Kukruse and No. 2 –7.03 Feeds other closed mines, outflow via Vahtsepa ditch into the Kohtla River Western closed mines Kohtla, Sompa and Mine No 4. –11.24 Intensive water exchange with other parts of the water body, feeds mostly Aidu opencast Geographical sites: Vasavere 1.09 Water inflow mostly from Ahtme mine, to some extent also from closed Tammiku mine Town of Jõhvi 0.15 Water infiltrates from closed mine No. 2 Conclusions and recommendations No great changes in the water level of closed mines and its seasonal variation are expected if no measures are taken. The situation should not change after the closure of presently working mines either. In future the water level of flooded Aidu opencast will be regulated by an outlet into the Ojamaa River at 40–42 m level, which will be also the common water level in Kohtla and Sompa mines. In the area of Viru and Estonia mines the groundwater will rise to the pre-mining level, which will result in an increase in groundwater flow into the Pühajõgi River at the eastern margin of Tammiku and Ahtme mines. It may turn necessary to regulate water level in the mining district. In order to reduce the flow of groundwater from mine No. 2 to the lower, area of the town of Jõhvi, the following options could be considered: • outlet of water at 51 m level at the northern boundary of the mine, near the adit of unbuilt mine No. 1 Technogenic Water in Closed Oil Shale Mines 27 • blasting of the barrier between mine No. 2 and Käva and Tammiku mines to enable water outflow towards the Kohtla River (at a level of 51 m) or into the Pühajõgi River (at 45–47 m level) • building of a pumping station regulating the water level and operating seasonally, but this is evidently not efficient due to great expenses. In order to reduce the water amounts penetrating into working mines and towards Vasavere intake, it would be purposeful to lower the water level in several closed mines: • to 45 m level in Tammiku mine, by dredging the present outlet • to 42–43 m level in Ahtme mine, by drilling artesian wells The quality of the water of closed mines is improving. The content of sulphates and iron in mine water decreases and in about five years after the closure of the mine is below the maximum level permitted in drinking water. Monitoring the water quality in closed mines should be aimed mostly at protecting the water body from surface-derived pollution. The sampling methods should be improved, with indicating justified times and places for taking water samples. In some cases the number of parameters measured could be reduced. As no reliable data are available about the formation and distribution of phenols in the water of closed mines, corresponding investigations are needed before the use of the water. Although phenols are generally believed to originate from the waste of shale oil plants or from burning spoil dumps, the possibility of their formation during decomposition of kerogen in water- filled mines cannot be excluded either. This hypothesis deserves further special study. Acknowledgements This paper was written within the framework of Grant 5913 of the Estonian Science Foundation “Usage of mined-out areas”, using the database of research No. 416L “Forecast of hydrogeological changes resulting from the activities of the Estonian Oil Shale Mining Company” carried out by Tallinn University of Technology. REFERENCES 1. Reinsalu, E. Sillamäe uranium mine // Environment Technics. 2001. No. 2. P. 40–45 [in Estonian]. 2. Reinsalu, E. Changes in mine dewatering after the closure of exhausted oil shale mines // Oil Shale. 2005. Vol. 22, No. 3. P. 261–273. 3. Erg, K. Changes in groundwater sulphate content in Estonian oil shale mining area // Oil Shale. 2005. Vol. 22, No. 3. P. 275–289. 28 E. Reinsalu, I. Valgma, H. Lind, K. Sokman 4. Savitski, L., Savva, V. Prognosis of hydrogeological changes in the mining district of the Estonian oil shale deposit, stages 1–3, 2001 [in Estonian] 5. Reinsalu, E., Toomik, A., Valgma, I. Mined out land, Tallinn, 2002 [in Estonian]. 6. Butakova, A., Jürgenfeldt, G., Reinsalu, E. Assessment of the mine water volume of water-filled oil shale mines // Gorjutšie slancy. 1980. No. 1. P. 6 [in Russian]. 7. Parahonski, E. Formation of mine water in oil shale mines and opencasts and mine drainage. Tallinn, Valgus, 1983 [in Russian]. 8. Domanova, N., Reinsalu, E. Analysis of hydrogeological conditions in Oktoobri opencast, Topic 0107, Stage HD No. 1, Estonian Branch of A. Skotchinski Institute of Mining Engineering, 1979 [in Russian]. 9. Domanova, N. Formation and forecast of water flowing into the mine workings driven into carbonate rocks with uneven infiltration properties. Candidate’s thesis, A. Skotchinski Institute of Mining Engineering, 1986 [in Russian]. 10. Domanova, N. Predicted increase in the water inflow into Viru mine due to the flooding of Tammiku mine. Estonian Oil Shale Company, Jõhvi, 1999. Manu- script [in Russian]. Recieved June 20, 2005
Oil Shale, 2006, Vol. 23, No. 1 ISSN 0208-189X pp. 15–28 © 2006 Estonian Academy Publishers The present paper is based on the results of the research conducted in 2004 by the Department of Mining of the Tallinn University of Technology and Estonian Oil Shale Company. The state of the technogenic water body that has formed in the central part of the oil shale deposit is analysed: the water level in the area of the stopped and closed mines, water amount and move- ment direction, water quality and its changes. The state of the water is assessed and predicted using modelling of the water tables, statistical analysis of the water quality parameters and the pilot model for describing the migration of water. The results show that the technogenic water body studied is in a relatively stable state, and the quality of the groundwater in that area is fast improving approaching the drinking water standards. Introduction The Estonia oil shale deposit comprises about ten closed and stopped deep mines that are fully or partly filled with water (Table 1). Eight mines in the central part of the deposit: Ahtme, Kohtla, Kukruse, Käva, Sompa, Tammiku and mines Nos. 2 and 4 form one water body. After Ahtme mine was filled with water in December 2004 (Fig. 1), the water body turned relatively stable. Ubja mine and joint Kiviõli and Küttejõu mine are located in the western part of the deposit, farther away from the other mines. In addi- tion to oil shale mines, Sillamäe uranium mine (1949–1952) [1], and Ülgase (1922–1938) and Maardu phosphorite mines (1942–1965) have been closed in Estonia. The water regime in these mines has not been studied yet and is not discussed in the present paper. * Table 1. Closed and flooded underground oil shale mines Mine Closed – (pumps were stopped) Mined area, km2 * Water table a.s.l., m Outflow regulating the water table Approximate water volume, 106 m3 Central part of the deposit: Kukruse 1967 13 51–54 Mostly into Käva and Jõhvi mines 3.5–6** Käva and Käva-2 1973 18 51–52 From an old adit into Vahtsepa ditch 9–11** Mine No. 2 (Jõhvi mine) 1974 13 51–56 Mostly into Tammiku mine, during flood to Jõhvi city 10–11** Mine No. 4 1975 13 41–42 Mostly into neigh bouring mines 3–8** Tammiku December 1999 40 44–48 Into the Kose River and Viru mine 34 Sompa February 2000 27 40–45 Into neighbouring mines 23 Kohtla June 2001 17 39–42 Into Aidu opencast 13 Ahtme December 2001 – December 2002 35 ≈ 47 From drill holes and springs into Sanniku brook 36 Separate mines in the western part of the deposit Kiviõli & Küttejõu 1989 29 41 ± 0.5 From a ditch into the Purtse River Up to 29 Ubja 1960 2 ≈ 55 From an adit into the Toolse River Not determined Total ≈ 170 * [5] ** Depending on the water level [6] As a rule, the mine workings and groundwater cone of depression formed during mining fill with water after the cease of mine pumping. The degree of filling depends on the mining depth and the height of outflow. The tunnels of Ahtme, Sompa and Tammiku mines are completely, those of mines Nos. 2 and 4 almost completely water-filled. The rest of the mines (Kiviõli, Kukruse and Käva) contain areas with dry floor. The museum founded in Kohtla mine is dry because of to the draining effect of Aidu opencast and the water barriers surrounding the exposition area. The water level changes depending Technogenic Water in Closed Oil Shale Mines 17 10 15 20 25 30 35 40 45 50 2002 2003 2004 2005 Water level, m Tarakuse well Pagari well Fig. 1. Increase in the water table in closed Ahtme mine on the amount of precipitation and water exchange with neighbouring mines. The rate and amplitude of the changes differ from mine to mine. Several problems have arisen from the flooding of the closed mines. First, the technogenic water body started to affect the amount of the water pumped out of the working mines and its seasonal variation [2]. Clearly, the water of the closed mines will influence also the new mines, planned to be constructed in the Ojamaa and Uus-Kiviõli mine fields. Second, the environ- ment is affected by the water that in several places has risen to the pre- mining level (of the year 1945) and by the new springs formed. Several projects have been undertaken to fight the flooding, and it has turned out that no sufficient source data for mine planning are available. Third, the water of the closed mines is an easily accessible water resource, thus it is important to know and predict its quality [3]. Prediction of the mine water quality is essential also because of the fact that groundwater elevation in the mine field has started to affect the water supply of the region – the water richer in sulphates runs into the outdated and leaky common wells. It has also been prognosticated that if the groundwater table rises higher than 45–47 m, the water in the Ahtme mine field will affect the water level and quality of the Vasavere intake [4]. Fourth, the land above old mines has subsided and the rocks are fractured, therefore the technogenic groundwater is weakly protected and the contribution of precipitation to groundwater formation is very high. Water level The present study is based on the water level measurement data (incl. archive data) provided by the Estonian Oil Shale Company, Geological Fig. 2. Map of the technogenic water body Technogenic Water in Closed Oil Shale Mines 19 Survey of Estonia and Municipality of the town of Jõhvi. The water levels of the Keila–Kukruse, Lasnamäe–Kunda and Nabala–Rakvere aquifers, closed mines and main outlets were measured on an average period of 20 years. New data were obtained in the years 2003 and 2004. Field works and monitoring started in the spring of 2004 and are still going on. An essential part of the research was the modelling of the level of the Keila–Kukruse aquifer in the stationary regime. The modelling area included the central part of the deposit – underground mines and Aidu opencast. Data from about 50 observation wells were used. The water level of working mines was described at the level of the oil shale bed floor. Closed mines were treated as independent water sub-bodies, where the water level is constant at a certain moment of time (Table 1). The MapInfo Professional software was used, combined with the modelling package Vertical Mapper. The comparison and calibration of the intermediate results obtained and discussions held showed that the best interpolation method was triangulation with smoothing, because in that case interpolation takes place only between data points or observation wells, without modelling the situation outside the study area. During the first stage of the research the state of the water body in August 2004 was assessed. According to the measurements and calculations performed, precipitation accounts for up to 70% of the water pumped out of mines [2]. The autumn–winter season of 2004 was rich in precipitation, with little snow and relatively warm. Therefore it could be expected that Ahtme mine would fill with water sooner than predicted [4]. To check that hypothesis, the model was calibrated at the second stage of the research in December 2004. The contour map of the modelled water table is shown in Fig. 2. By continuous improvement of the existing and addition of new data more than ten two- and three-dimensional map versions were completed. The model enabled us to assess the water levels in different mines and their border areas and to make assumptions and predictions about the water move- ment directions. Water quality In the years 2000–2004 the department of environmental services of the Estonian Oil Shale Company had the waters of all closed mines analysed. The samples were taken at six sites in four mines in different seasons. Analyses were made at the central laboratory of the Estonian Oil Shale Company (3 analyses), in Tartu Environmental Research Ltd. (2 analyses) and in the Geological Survey of Estonia (12 analyses). Up to 16 quality parameters were determined. The results of the analyses are presented in Table 2. The quality parameters are arranged in Table 2 in the decreasing order of the variation in measurement results. At first glance only the average contents of iron, sulphates and phenols obtained for the observation period do not meet the drinking water standards. This cannot be a final conclusion. The average Table 2. Water quality parameters in closed Ahtme, Kohtla, Sompa and Tammiku mines Quality parameter Unit Number of measurement results Numerical data for the entire period (2000–2004) Leachates Total Certain numerical values Arithmetical mean Standard deviation Variation coefficient Max. levels permitted in drinking water Total Fe mg/l 14 10* 0.69 1.16 1.67 <0.2 NO3 - mg/l 15 11* 11.7 18.55 1.58 <50 NO2 - mg/l 12 7* 0.015 0.0166 1.10 <0.5 SO4 2- mg/l 15 15 342.4 240.2 0.70 <250 Dry residue mg/l 14 14 845.5 569.6 0.67 – Mg2+ mg/l 15 15 51.6 32.58 0.63 – K+ mg/l 13 13 12.9 8.11 0.63 – Ca2+ mg/l 15 15 174.5 107.6 0.62 – Na+ mg/l 14 14 10.4 6.33 0.61 <200 Cl mg/l 15 15 16.4 9.74 0.59 <250 Total hardness mge/l 13 13 13.72 7.04 0.51 – Oil products mg/l 15 4* 0.15 0.073 0.49 <0.05 Conductivity μS/cm 14 14 1095 477.6 0.44 <2500 NH4 + mg/l 12 2* 0.017 0.0064 0.39 <0.5 Total phenols mg/l 15 4** 0.0017 0.00049 0.28 <0.0005 pH 15 15 7.1 0.33 0.05 6.5–9.5 * due to the lack of a certain numerical value the result was smaller than the preciseness of the laboratory tests, but not exceeding the limits permitted in drinking water ** due to the lack of a certain numerical value the result was smaller than the preciseness of the laboratory tests, in two cases not exceeding the limits permitted in drinking water; rest of the samples gave no unique result Notes: Quality parameters are ordered according to the variation coefficient. The shaded lines contain the measurement results the average of which does not meet the Estonian drinking water standard. The content of benzo(a)pyrene was measured in 11 samples. The results are not included in the table because no certain numerical values were obtained. In all samples the benzo(a) pyrene content was lower than the permitted maximum value. and standard deviations given in the table have been calculated for all closed mines and for the entire observation period, thus they characterize only the data set and not the quality of water or a particular mine. Variation in the measurement results is caused by influential as well as random factors. Influential factors are the sampling site (mine) and the time span that has passed since the closure of the mine. Let us treat this assumption as a working hypothesis. A random factor is the season when sampling was performed. For example, in the years 2000 and 2001 samples were taken in summer, in 2002– 2004 in autumn. Surely the water quality parameters depend also on the Technogenic Water in Closed Oil Shale Mines 21 location of the sampling site in the mine field. Some part of variations result from the methodology of sampling and laboratory tests. The reliability of iron content analyses carried out in different laboratories could be questioned. The phenol content of mine water, measured repeatedly during mining, has been 0.003 ± 0.001 mg/l, except for Kiviõli mine, which has been strongly affected by chemical industry. Here the phenol content of mine water was 0.38 mg/l [7]. For preliminary checking of the working hypothesis we conducted a two- factor (place and time) variation analysis of the sulphate and iron contents of Tammiku and Sompa mine waters. The results of sulphate analysis are given in Table 3. We can see that the hypothesis of the influence of place and time on the sulphate content of water is relatively strong (probability of a counter- hypothesis 18.0 and 18.8% respectively). The residual standard deviation (187 mg/l), however, is too large for making definite conclusions. Obviously the result is influenced by taking samples in different seasons. An analogous result was obtained by the variation analysis of the iron content, whereas the impact of time turned out to be small. Possibly this could result from the treatment of samples in different laboratories. In spite of great uncertainty of measurement, the sulphate and iron contents decrease with time. This trend is depicted by graphs in Fig. 3. As could be expected, the purification of water is best described by the exponential function. The constants in the formulae (801 and 0.77 mg/l, respectively) characterize the average concentrations at the initial moment of the dilution process (at the closure of mines) and the time factors (–0.386 and –0.507, respectively) show the rate of water purification. The half-life of the concentration calculated on the basis of time factors, i.e. the time period during which the content of a component decrease twice, is about 1.8 years for sulphates and 1.4 years for iron. From the half-life and graphs we may presume that in about five years after the closure of a mine the content of sulphates and iron decreases below the maximum permitted level in drinking water. The highest permitted content of iron in first-class drinking water is 0.2 m/l and that of sulphates 250 m/l. The data on all mines are included in the graphs of Fig. 3. The measure- ments revealed varying initial concentrations of sulphates for different mines. The highest concentration was recorded in the first sample from Ahtme mine, the lowest in Kohtla mine. Actually, this is not the initial level, since the first samples were taken 4–11 months after the pumps had been stopped. Approximating the results obtained from the samples of each mine separately, we get theoretical dilution of the initial concentration level at the zero moment, about 2200 mg/l for Ahtme and 300 mg/l for Sompa. These values refer to a relation between the depth of the mine and the initial concentration of sulphates. The hydrogeological background of this pheno- menon is discussed by Erg [3]. Table 3. Results of the variation analysis of the content of sulphates Source of Variation df MS F P-value Mines (Tammiku, Sompa) 1 91681 2.63 0.180 Years (2002–2004) 4 92788 2.66 0.183 Error 4 34924 Residual Standard Deviation 187 mg/l Total 9 SO4 2- = 801 e-0.386 t, mg/l R2 = 0.46 10 100 1000 10000 01234567 t - closed, years SO42- - sulphate content, mg/l 250 mg/l Fe = 0.77 e -0.509 t , mg/l R2 = 0.39 0.01 0.1 1 10 01234567 t - closed, years Fe content, mg/l 0.2 mg/l Fig. 3. Decrease in the content of SO4 2- and Fe in closed mines. 250 mg/l and 0.2 mg/l – maximum permitted levels in drinking water. The water quality parameters for which we had at least 14 reliable measurement results (pH, electric conductivity, total hardness, Cl- , dry Technogenic Water in Closed Oil Shale Mines 23 residue, Na+ , Ca2+, Mg2+, K+ and SO4 2- ) were subjected to correlation analysis. From the analysis we could conclude the following: • The content of sulphates can be considered a good indicator of mine water quality, because it correlates well with most of the other water quality parameters, except for K+ . • Electric conductivity can be successfully used for rapid assessment of water quality, because it correlates well with sulphates as well as with other main parameters (except for K+ ). • pH is not informative enough, because it does not correlate with any other water quality parameter. Pilot model of water exchange Continuous water exchange is going on between the closed mines. The water penetrating into mines is derived mostly from precipitation, less from groundwater. The part of the water not flowing out of the mine (Table 1) infiltrates into the neighbouring mines or feeds aquifers. The water pumped out of the working mines is formed of precipitation, groundwater and the water coming from closed mines. Intensity of water exchange depends on the length (L, km) and thickness (l, m) of the barrier left between the mines, difference between the water levels of neighbouring mines (dh, m) and permeability of the barrier and overburden (km, m2 /d). The longer and thinner is the barrier, the greater is the water level difference in neighbouring water bodies, and the higher is the permeability of rocks in the areas separating the mines, the more intensive is the exchange of water. The water levels of the closed mines are precisely known. The measure- ments of barriers can be obtained from the plan of mining works, but the length and thickness of the barriers are highly variable. Little data are available on the permeability of pillars and bedrock. As seen in Table 4, the permeability of the Keila–Kukruse aquifer differs up to 10 times within the limits of the deposit. Water permeability is largely affected by the geological disturbance of the Earth crust (mostly karst zones), which makes the aquifer highly aniso- tropic [8, 9]. In the Estonia mine field twofold difference in the permeability in the northeastern and southeastern directions has been recorded. According to the data by Domanova, anisotropy is especially great in the area of tectonic dislocations, where permeability in various directions may differ several times. Water exchange between the mines is inhibited by extensive karst zones running along the mine field boundaries between Sompa and Viru, and Ahtme and Tammiku mines. At the same time, karst zones running transversely to the mine boundary increase the water exchange between Sompa and Kohtla mines. Additionally, the water exchange is affected by the properties of the mined area, which depend on the roof handling methods used. In the area Table 4. Permeability of the Keila–Kukruse groundwater aquifer in the mining district Filtration module Publication District Permeability, m2 /d Estimated difference in water tables, m m/h m/d Kohtla – Aidu, northern part 1200 5 10 240 Kohtla – Aidu, central part 780 10 3.25 78 [8] Kohtla 6–60 Viru 10–40 [7] Aidu, generalized 393 10 1.6 39 Ahtme, generalized 335 10 1.4 34 [4] Tammiku 4–20 Ahtme 1–15 [7] Ahtme – Estonia 90 10 0.38 9 [4] No. 2 – Tammiku 0.24 6 [10] mined using roof caving the water-bearing horizon is thicker and of higher permeability than in the area of room-and-pillar mining. Because of high uncertainty the calculation of the water amounts moving between the closed mines is complicated, not only due to the variability in L, l, k, but also due to the lack of the relation uniquely describing all the situations. Therefore the present study makes use of the balance method, which unites the amounts of the water pumped out of the working mines, and of precipitation and groundwater infiltrating into the mine. The relation between these amounts is expressed by the approximate formula qij = 365.25 × Lij × kij × (dhij/2) / (1000 × lij), where qij – the amount of the water migrating from one mine (i) to the other (j), million m3 /y, Lij – length of the barrier between these mines, km, lij – average thickness of the barrier, m, dhji – difference between the water levels of two closed mines at the moment of modelling, m, kij – factor characterizing the permeability of the area between the mines (barriers and overlying rock), which, with some reservation, can be considered as generalized permeability, m2 /d. As model input we use the measurements of the barriers between the mines, volume of the water pumped out of the working mines (especially changes in it due to the closure of neighbouring mines), amount of precipita- tion and its relation to mine pumping [2]. The variable parameter of the Technogenic Water in Closed Oil Shale Mines 25 model is generalized permeability, which is used to balance the model. Permeability was fitted into the model taking into consideration the informa- tion available (Table 4), location of mines with respect to tectonic fault zones and the orientation of the karst zones lying between the mines. The balanced model can be used for calculating the migrating water amounts by fluctuations in water level, for example during floods and heavy rains, but also for planning water level regulations. The model output is the matrix of water exchange (Table 5), where • “North” denotes the northern closed mines No. 2, Kukruse, and Käva and its satellite mines • “West” denotes the western closed mines Kohtla, Sompa and No. 4 • “Vasavere” is the area east of Ahtme and Estonia mines • The water amounts in the matrix of water exchange are given in million m3 /y, whereas (+) shows the amounts infiltrating into the mine (i) from the mine (j) and (–) shows the amounts migrating from the mine (i) to the other mine. Explanations to the matrix of water exchange are given in Table 6. Water movement inside the water body and the amounts of mine pumping are shown in Fig. 1. The values presented characterize the state of the water body in the year 2004, but as we have to do with a pilot model, these are all approximate. Table 5. Matrix of water exchange, year 2004, 106 m3 /y ↓Elements of the water body → Aidu Estonia Viru Ahtme Tammiku North West Vasavere Jõhvi city Sum Working mines: Aidu 0.00 0.00 0.00 0.00 0.00 0.00 14.46 0.00 0.00 14.46 Estonia 0.00 0.00 1.64 6.48 0.00 0.00 0.00 0.48 0.00 8.60 0.00 0.00 –1.64 0.00 0.18 7.23 0.00 3.07 0.00 0.00 8.83 Technogenic water body; closed mines (sub-bodies): Ahtme 0.00 –6.48 –0.18 0.00 0.07 0.00 0.00 –1.07 0.00 –7.65 Tammiku 0.00 0.00 –7.23 –0.07 0.00 2.28 –1.69 –0.50 0.00 –7.22 North 0.00 0.00 0.00 0.00 –2.28 0.00 –4.60 0.00 –0.15 –7.03 West – 14.46 0.00 –3.07 0.00 1.69 4.60 0.00 0.00 0.00 –11.24 Geographical sites: Vasavere 0.00 –0.48 0.00 1.07 0.50 0.00 0.00 0.00 0.00 1.09 Town of Jõhvi 0.00 0.00 0.00 0.00 0.00 0.15 0.00 0.00 0.00 0.15 Table 6. Water exchange between mines Mines, techno- genic water sub-bodies and geographical sites Water exchange, 106 m3 /y Comments Working mines: Aidu 14.46 Inflow from closed Kohtla mine Estonia 8.60 Main inflow from closed Ahtme mine, less from the direction of working Viru mine, partly also from the east Viru 8.83 Inflow from closed Tammiku and Sompa mines, slight outflow into Estonia mine Technogenic water body; closed mines (sub-bodies): Ahtme –7.65 Outflow mainly into Estonia mine and into the catchment area of the Pühajõgi River through springs and outflow wells Tammiku –7.22 Intensive water exchange with other parts of the water body, out flow into the catchment area of the Pühajõgi River through a caving at Kose Northern closed mines Käva, Kukruse and No. 2 –7.03 Feeds other closed mines, outflow via Vahtsepa ditch into the Kohtla River Western closed mines Kohtla, Sompa and Mine No 4. –11.24 Intensive water exchange with other parts of the water body, feeds mostly Aidu opencast Geographical sites: Vasavere 1.09 Water inflow mostly from Ahtme mine, to some extent also from closed Tammiku mine Town of Jõhvi 0.15 Water infiltrates from closed mine No. 2 Conclusions and recommendations No great changes in the water level of closed mines and its seasonal variation are expected if no measures are taken. The situation should not change after the closure of presently working mines either. In future the water level of flooded Aidu opencast will be regulated by an outlet into the Ojamaa River at 40–42 m level, which will be also the common water level in Kohtla and Sompa mines. In the area of Viru and Estonia mines the groundwater will rise to the pre-mining level, which will result in an increase in groundwater flow into the Pühajõgi River at the eastern margin of Tammiku and Ahtme mines. It may turn necessary to regulate water level in the mining district. In order to reduce the flow of groundwater from mine No. 2 to the lower, area of the town of Jõhvi, the following options could be considered: • outlet of water at 51 m level at the northern boundary of the mine, near the adit of unbuilt mine No. 1 Technogenic Water in Closed Oil Shale Mines 27 • blasting of the barrier between mine No. 2 and Käva and Tammiku mines to enable water outflow towards the Kohtla River (at a level of 51 m) or into the Pühajõgi River (at 45–47 m level) • building of a pumping station regulating the water level and operating seasonally, but this is evidently not efficient due to great expenses. In order to reduce the water amounts penetrating into working mines and towards Vasavere intake, it would be purposeful to lower the water level in several closed mines: • to 45 m level in Tammiku mine, by dredging the present outlet • to 42–43 m level in Ahtme mine, by drilling artesian wells The quality of the water of closed mines is improving. The content of sulphates and iron in mine water decreases and in about five years after the closure of the mine is below the maximum level permitted in drinking water. Monitoring the water quality in closed mines should be aimed mostly at protecting the water body from surface-derived pollution. The sampling methods should be improved, with indicating justified times and places for taking water samples. In some cases the number of parameters measured could be reduced. As no reliable data are available about the formation and distribution of phenols in the water of closed mines, corresponding investigations are needed before the use of the water. Although phenols are generally believed to originate from the waste of shale oil plants or from burning spoil dumps, the possibility of their formation during decomposition of kerogen in water- filled mines cannot be excluded either. This hypothesis deserves further special study. Acknowledgements This paper was written within the framework of Grant 5913 of the Estonian Science Foundation “Usage of mined-out areas”, using the database of research No. 416L “Forecast of hydrogeological changes resulting from the activities of the Estonian Oil Shale Mining Company” carried out by Tallinn University of Technology. REFERENCES 1. Reinsalu, E. Sillamäe uranium mine // Environment Technics. 2001. No. 2. P. 40–45 [in Estonian]. 2. Reinsalu, E. Changes in mine dewatering after the closure of exhausted oil shale mines // Oil Shale. 2005. Vol. 22, No. 3. P. 261–273. 3. Erg, K. Changes in groundwater sulphate content in Estonian oil shale mining area // Oil Shale. 2005. Vol. 22, No. 3. P. 275–289. 28 E. Reinsalu, I. Valgma, H. Lind, K. Sokman 4. Savitski, L., Savva, V. Prognosis of hydrogeological changes in the mining district of the Estonian oil shale deposit, stages 1–3, 2001 [in Estonian] 5. Reinsalu, E., Toomik, A., Valgma, I. Mined out land, Tallinn, 2002 [in Estonian]. 6. Butakova, A., Jürgenfeldt, G., Reinsalu, E. Assessment of the mine water volume of water-filled oil shale mines // Gorjutšie slancy. 1980. No. 1. P. 6 [in Russian]. 7. Parahonski, E. Formation of mine water in oil shale mines and opencasts and mine drainage. Tallinn, Valgus, 1983 [in Russian]. 8. Domanova, N., Reinsalu, E. Analysis of hydrogeological conditions in Oktoobri opencast, Topic 0107, Stage HD No. 1, Estonian Branch of A. Skotchinski Institute of Mining Engineering, 1979 [in Russian]. 9. Domanova, N. Formation and forecast of water flowing into the mine workings driven into carbonate rocks with uneven infiltration properties. Candidate’s thesis, A. Skotchinski Institute of Mining Engineering, 1986 [in Russian]. 10. Domanova, N. Predicted increase in the water inflow into Viru mine due to the flooding of Tammiku mine. Estonian Oil Shale Company, Jõhvi, 1999. Manu- script [in Russian]. Recieved June 20, 2005
Paper: USING MAPINFO VERTICAL MAPPER INTERPOLATION TECHNIQUES FOR ESTONIAN OIL SHALE RESERVE CALCULATIONS
Paper: Valgma: USING MAPINFO VERTICAL MAPPER INTERPOLATION TECHNIQUES FOR ESTONIAN OIL SHALE RESERVE CALCULATIONS
USING MAPINFO VERTICAL MAPPER INTERPOLATION TECHNIQUES FOR ESTONIAN OIL SHALE RESERVE CALCULATIONS INGO VALGMA Summary A digital map of Estonian oil shale mining was created for joining data of technological, environmental, and social limitations in the deposit with area of 2900 km2. For evaluating potential resource of oil shale its amount, tonnage and energy were calculated. Then the quantity of economical oil shale for power plants and shale oil resource were calculated. Seam thickness was interpolated from analyzed and calculated data points of the oil shale seam and a model was created for visual control. Calculating and interpolating energy rating per square metre is necessary for energy resource evaluation. Energy rating is the most important factor for determining oil shale reserve in the case of using it for electricity generation. In the case of oil production, figures of oil yield and resource in oil shale are the most important figures for determining the value of the deposit. Basing on the models, oil resource has been calculated. Choosing between various interpolations showed that Inverse Distance Weighting gives the most reliable figures for oil shale tonnage with available data. Natural Neighbor Regions and Kriging are the more suitable methods when using detailed data. Introduction Oil shale bed in Estonia is deposited in the depth of 0…100 m with the thickness of 1.4…3.2 m in the area of 2884 km2 (Figure 1). The mineable seam consists of seven kukersite layers and four to six limestone interlayers. The layers are named A…F1. The energy rating of the bed is 15…45 GJ/m2. Figure 1 Baltic oil shale area Oil shale mining in Estonia province started in 1916, it was extracted in surface mines using the opencast method. Underground mining started in 1922. Room-and-pillar mining, which is the only underground oil shale mining method today, started in 1960. During the years 1971…2001 longwall mining with shearers was used in some of the mines. In total ten oil shale surface mines and 13 underground mines have been in operation. Probability of opening new operations is high in the case if oil shale processing or cement productions are becoming more active. The criteria of the oil shale reserve The criteria of the oil shale reserve are energy rating, calorific value of the layers, thickness and depth of the seam, location, available mining technology, world price of competitive fuel and its transporting cost, oil shale mining and transporting cost. In addition, nature protection areas are limiting factors for mining. The economic criterion for determining Estonia’s kukersite* oil shale reserve for electricity generation is the energy rating of the seam in GJ/m2. It is calculated as the sum of the products of thickness, calorific values and densities of all oil shale layers A-F1 and limestone interlayers. A reserve is mineable when energy rating of the block is at least 35 GJ/m2 and subeconomic if energy rating is 25…35 GJ/m2. According to the Balance of Estonian Natural Resources, as an example the oil shale reserve was 5 billion tonnes in the year 2000. Economic reserve was 1.5 billion t and subeconomic 3.5 billion t (Table 1). These figures apply to oil shale usage for electricity generation in power plants and are calculated only by oil shale layers, which is fiction because in most cases total bed is used for combustion. In the case of wide-scale using of oil shale for cement or oil production, the criteria must be changed. Modeling In total 375 data points have been used for modeling (Figure 2). Every data point represents data of one reserve block with 5 to 15 drill holes and has been taken as an average for an area about seven km2. Figure 2 Map of source data from geological investigation. Contours show exploration fields. The northern border of the deposit is an outcrop line Basing on geological data, several grids of oil shale layers and seam were created - those of the height, thickness, in-place tonnage, energy rating, overburden thickness and stripping coefficient. Oil shale resource For evaluating potential resource of oil shale, its amount, tonnage and energy must be calculated. Then the quantity of economical oil shale for power plants and shale oil resource is calculated. It is necessary to follow the criteria for choosing the most appropriate interpolation method. It is not possible to choose right interpolation method beforehand because of numerous options of methods and criteria. Appropriate methods for every operation will be established during calculations. Seam thickness was interpolated from 375 calculated data points of the oil shale seam and a model was created for visual control. Assuming that Estonian oil shale deposit is a combination of current exploration fields, the polygon shown in Figure 3 marks the deposit border covering 2884 km2. The quantity of the oil shale seam could be calculated by extracting thickness and corresponding areas from the created isopachs using SQL query. Inverse distance weighting, triangulation with smoothing, natural neighbor, rectangular interpolation and Kriging methods could be used for interpolation. Reliable data allow to use Voronoi diagram, triangulation and rectangular interpolation. Unreliable data require Inverse Distance Weighting and Kriging. All criteria are summarized in Table 2. Shaded rows show suitable criteria for calculating oil shale tonnage. Natural neighbor is the most suitable method because the initial data were subjectively interpreted average values of exploration blocks. Inverse Distance Weighting Interpolation can also be used because the errors of the initial data exceed smoothing level of the method. Smoothed isopleths give a more clear overview of the deposit and allow extrapolate the data beyond the data points. Table 2 Criteria for choosing interpolation methods. Marks show suitable methods for specific data. Shaded rows show suitable criteria for calculating oil shale tonnage Calculating and interpolating energy rating per square meter is necessary for energy resource evaluation. The graph based on the model (Figure 3) shows the energy ranges of mined oil shale in the deposit, its quantity already mined out and the available resource. Most of mined out oil shale seam has had energy rating more than 35 GJ/m2 (Figure 4). Energy rating of the seam is used as an essential argument for economical calculations. Figure 3 Energy rating of oil shale, GJ/m2. The resource over 35 GJ/m2 is economic reserve. Bold conurs in north show mined out area. Figure 4 Oil shale resource in Estonian deposit on PJ. Most of the mined out seam has contained energy more than 35 GJ/m2 Models enable to present the graphs of energy rating showing its extent and ranges. Energy rating is the most important factor for determining oil shale reserve in the case of using it for electricity generation. In the case of oil production, figures of oil yield and resource in oil shale are the most important figures for determining the value of the deposit. Basing on the models, oil resource has been calculated and is presented in Figure 5. Figure 5 Shale oil resource, Th t in ranges of oil yield Choosing between various interpolation methods showed that Inverse Distance Weighting (IDW) gives the most reliable figures for oil shale tonnage with available initial data. Natural Neighbor regions (NN) and Kriging are the more suitable interpolation methods when using more detailed data and blocks. Rectangular Interpolation is unsuitable in the case of irregular mesh of the initial data. All methods give 2,3m for average oil shale thickness except rect. interpolation that gives 2,1m and 11% deviation. Other methods give deviation from 1 to 3 %, which are smaller than errors of initial data. Results of the study The main results are data models of the deposit such as isopleths and 3D drawings of mining conditions like seam thickness, seam depth, calorific value of oil shale and oil yield. The main possible calculations basing on oil shale bedding models are choosing optimum mining location, dynamics and statistics of the mining phenomenon, evaluation of oil shale quantity, energy and oil reserve. Inverse Distance Weighting method gives satisfactory data for the deposit overview (Table 3), other suitable methods can be used for modeling with all initial drill hole data in case of resource calculations in specific location. Table 3 Data of Estonian oil shale deposit. Calculated with inverse distance weighting method. This study is financed by EstSF Grant No. 4870 Oil Shale Resource. References References and additional information on Estonian oil shale can be found on page http://www.ttu.ee/maeinst/mgis 1. Valgma I. Geographical Information System for Oil Shale Mining - MGIS. Thesis on Mining Engineering. http://www.ttu.ee/maeinst/mgis Tallinn Technical University. 2002 2. Valgma, I., Map of oil shale mining history in Estonia, Proc. II. 5th Mining History Congress, Greece, Milos Conference Centre- George Eliopoulos, 2001, 198…193 3. Valgma I. Mapping potential areas of ground subsidence in Estonian underground oil shale mining district. Proceedings of the 2nd International Conference “Environment. Technology. Resources”. Rezekne, Latvia 25-27 June 1999, 227...232 4. Valgma I. Post-stripping processes and the landscape of mined areas in Estonian oil shale open-casts. Oil Shale, 2000, Vol. 17, No. 2, 201…212 5. Valgma I. Using MapInfo Professional and Vertical Mapper for mapping Estonian oil shale deposit and analysing technological limit of overburden thickness. Proceedings of International Conference on GIS for Earth Science Applications, Institute for Geology, Geotechnics and Geophysics, Slovenia Ljubljana 17.-21. May 1998, 187…194 * In addition to kukersite oil shale in Estonia, there are occurrences of another kind of oil shale – dictyonema argillite, mined and used in Sillamäe for extracting uranium in 1948…1953.
USING MAPINFO VERTICAL MAPPER INTERPOLATION TECHNIQUES FOR ESTONIAN OIL SHALE RESERVE CALCULATIONS INGO VALGMA Summary A digital map of Estonian oil shale mining was created for joining data of technological, environmental, and social limitations in the deposit with area of 2900 km2. For evaluating potential resource of oil shale its amount, tonnage and energy were calculated. Then the quantity of economical oil shale for power plants and shale oil resource were calculated. Seam thickness was interpolated from analyzed and calculated data points of the oil shale seam and a model was created for visual control. Calculating and interpolating energy rating per square metre is necessary for energy resource evaluation. Energy rating is the most important factor for determining oil shale reserve in the case of using it for electricity generation. In the case of oil production, figures of oil yield and resource in oil shale are the most important figures for determining the value of the deposit. Basing on the models, oil resource has been calculated. Choosing between various interpolations showed that Inverse Distance Weighting gives the most reliable figures for oil shale tonnage with available data. Natural Neighbor Regions and Kriging are the more suitable methods when using detailed data. Introduction Oil shale bed in Estonia is deposited in the depth of 0…100 m with the thickness of 1.4…3.2 m in the area of 2884 km2 (Figure 1). The mineable seam consists of seven kukersite layers and four to six limestone interlayers. The layers are named A…F1. The energy rating of the bed is 15…45 GJ/m2. Figure 1 Baltic oil shale area Oil shale mining in Estonia province started in 1916, it was extracted in surface mines using the opencast method. Underground mining started in 1922. Room-and-pillar mining, which is the only underground oil shale mining method today, started in 1960. During the years 1971…2001 longwall mining with shearers was used in some of the mines. In total ten oil shale surface mines and 13 underground mines have been in operation. Probability of opening new operations is high in the case if oil shale processing or cement productions are becoming more active. The criteria of the oil shale reserve The criteria of the oil shale reserve are energy rating, calorific value of the layers, thickness and depth of the seam, location, available mining technology, world price of competitive fuel and its transporting cost, oil shale mining and transporting cost. In addition, nature protection areas are limiting factors for mining. The economic criterion for determining Estonia’s kukersite* oil shale reserve for electricity generation is the energy rating of the seam in GJ/m2. It is calculated as the sum of the products of thickness, calorific values and densities of all oil shale layers A-F1 and limestone interlayers. A reserve is mineable when energy rating of the block is at least 35 GJ/m2 and subeconomic if energy rating is 25…35 GJ/m2. According to the Balance of Estonian Natural Resources, as an example the oil shale reserve was 5 billion tonnes in the year 2000. Economic reserve was 1.5 billion t and subeconomic 3.5 billion t (Table 1). These figures apply to oil shale usage for electricity generation in power plants and are calculated only by oil shale layers, which is fiction because in most cases total bed is used for combustion. In the case of wide-scale using of oil shale for cement or oil production, the criteria must be changed. Modeling In total 375 data points have been used for modeling (Figure 2). Every data point represents data of one reserve block with 5 to 15 drill holes and has been taken as an average for an area about seven km2. Figure 2 Map of source data from geological investigation. Contours show exploration fields. The northern border of the deposit is an outcrop line Basing on geological data, several grids of oil shale layers and seam were created - those of the height, thickness, in-place tonnage, energy rating, overburden thickness and stripping coefficient. Oil shale resource For evaluating potential resource of oil shale, its amount, tonnage and energy must be calculated. Then the quantity of economical oil shale for power plants and shale oil resource is calculated. It is necessary to follow the criteria for choosing the most appropriate interpolation method. It is not possible to choose right interpolation method beforehand because of numerous options of methods and criteria. Appropriate methods for every operation will be established during calculations. Seam thickness was interpolated from 375 calculated data points of the oil shale seam and a model was created for visual control. Assuming that Estonian oil shale deposit is a combination of current exploration fields, the polygon shown in Figure 3 marks the deposit border covering 2884 km2. The quantity of the oil shale seam could be calculated by extracting thickness and corresponding areas from the created isopachs using SQL query. Inverse distance weighting, triangulation with smoothing, natural neighbor, rectangular interpolation and Kriging methods could be used for interpolation. Reliable data allow to use Voronoi diagram, triangulation and rectangular interpolation. Unreliable data require Inverse Distance Weighting and Kriging. All criteria are summarized in Table 2. Shaded rows show suitable criteria for calculating oil shale tonnage. Natural neighbor is the most suitable method because the initial data were subjectively interpreted average values of exploration blocks. Inverse Distance Weighting Interpolation can also be used because the errors of the initial data exceed smoothing level of the method. Smoothed isopleths give a more clear overview of the deposit and allow extrapolate the data beyond the data points. Table 2 Criteria for choosing interpolation methods. Marks show suitable methods for specific data. Shaded rows show suitable criteria for calculating oil shale tonnage Calculating and interpolating energy rating per square meter is necessary for energy resource evaluation. The graph based on the model (Figure 3) shows the energy ranges of mined oil shale in the deposit, its quantity already mined out and the available resource. Most of mined out oil shale seam has had energy rating more than 35 GJ/m2 (Figure 4). Energy rating of the seam is used as an essential argument for economical calculations. Figure 3 Energy rating of oil shale, GJ/m2. The resource over 35 GJ/m2 is economic reserve. Bold conurs in north show mined out area. Figure 4 Oil shale resource in Estonian deposit on PJ. Most of the mined out seam has contained energy more than 35 GJ/m2 Models enable to present the graphs of energy rating showing its extent and ranges. Energy rating is the most important factor for determining oil shale reserve in the case of using it for electricity generation. In the case of oil production, figures of oil yield and resource in oil shale are the most important figures for determining the value of the deposit. Basing on the models, oil resource has been calculated and is presented in Figure 5. Figure 5 Shale oil resource, Th t in ranges of oil yield Choosing between various interpolation methods showed that Inverse Distance Weighting (IDW) gives the most reliable figures for oil shale tonnage with available initial data. Natural Neighbor regions (NN) and Kriging are the more suitable interpolation methods when using more detailed data and blocks. Rectangular Interpolation is unsuitable in the case of irregular mesh of the initial data. All methods give 2,3m for average oil shale thickness except rect. interpolation that gives 2,1m and 11% deviation. Other methods give deviation from 1 to 3 %, which are smaller than errors of initial data. Results of the study The main results are data models of the deposit such as isopleths and 3D drawings of mining conditions like seam thickness, seam depth, calorific value of oil shale and oil yield. The main possible calculations basing on oil shale bedding models are choosing optimum mining location, dynamics and statistics of the mining phenomenon, evaluation of oil shale quantity, energy and oil reserve. Inverse Distance Weighting method gives satisfactory data for the deposit overview (Table 3), other suitable methods can be used for modeling with all initial drill hole data in case of resource calculations in specific location. Table 3 Data of Estonian oil shale deposit. Calculated with inverse distance weighting method. This study is financed by EstSF Grant No. 4870 Oil Shale Resource. References References and additional information on Estonian oil shale can be found on page http://www.ttu.ee/maeinst/mgis 1. Valgma I. Geographical Information System for Oil Shale Mining - MGIS. Thesis on Mining Engineering. http://www.ttu.ee/maeinst/mgis Tallinn Technical University. 2002 2. Valgma, I., Map of oil shale mining history in Estonia, Proc. II. 5th Mining History Congress, Greece, Milos Conference Centre- George Eliopoulos, 2001, 198…193 3. Valgma I. Mapping potential areas of ground subsidence in Estonian underground oil shale mining district. Proceedings of the 2nd International Conference “Environment. Technology. Resources”. Rezekne, Latvia 25-27 June 1999, 227...232 4. Valgma I. Post-stripping processes and the landscape of mined areas in Estonian oil shale open-casts. Oil Shale, 2000, Vol. 17, No. 2, 201…212 5. Valgma I. Using MapInfo Professional and Vertical Mapper for mapping Estonian oil shale deposit and analysing technological limit of overburden thickness. Proceedings of International Conference on GIS for Earth Science Applications, Institute for Geology, Geotechnics and Geophysics, Slovenia Ljubljana 17.-21. May 1998, 187…194 * In addition to kukersite oil shale in Estonia, there are occurrences of another kind of oil shale – dictyonema argillite, mined and used in Sillamäe for extracting uranium in 1948…1953.
Paper: Valgma, I. (2001) Map of oil shale mining history in Estonia
txt: Map of oil shale mining history in Estonia Ingo Valgma, M.Sc., PhD student The Mining Institute of Tallinn Technical University, Kopli 82, Tallinn, 10412, Estonia, Internet address http://www.ttu.ee/maeinst/ Phone: +372 620 38 50, Fax: + 372 620 36 96, E-mail: ingoval@cc.ttu.ee Poster will be presented as detailed map of oil shale mining technology, including illustrative diagrams and photographs, overview could be found on http://mgis.gz.ee/ Overview. Oil Shale is Estonia’s prime mineral resource. Oil shale is deposited in a single economic layer with thickness of 2,5 to 3 meters in depth of 7 to 100 meters in area of 2700 km2. Its production makes 70 percent of world’s oil shale production and two thirds of Estonia’s total mineral production. Mining activity started in 1916, peaked in 1980 and is ending in next 30 years. Therefore it is important to save oil shale mining history in easily accessible database. The Mining Institute of Tallinn Technical University has created geographically referenced database of oil shale. MapInfo Professional is used for mapping geology and mining situation. The map includes research and mining fields, mineral and overburden properties, underground and surface workings. Additionally technological diagrams and data are saved. For analyzing underground mining influences, exact current mining situation and previous situation is compared with surface topology in mined out areas. Open cast mining results are compared with aerial photos and digital base maps. Both underground and surface oil shale mining started by handwork. Analyses show that mining influence to the environment from this period has been minimum. As technology developed and political situation changed, the influence increased with raise of production capacity. The conditions for starting of oil shale mining and promoting of development were the war time fuel crisis, the lack of fuel mineral deposits, particularly of oil deposits environs, the interest for fuels by Russia and Germany, particularly for navy, good mining conditions and high quality of the oil shale, disengaged labor. The favorable reasons for liquidating mining activities in Estonia are elimination of interests of great powers, discovering of new oil and gas deposits elsewhere and the development of transportation of fuel minerals, deterioration of mining conditions, exhausting of best reserves and environmental reasons. Figure 1. General overview of the Baltic oil shale area The reason for oil shale exploitation in the area of former Russia was the crisis of fuel consumption in the time of World War I. At the beginning oil shale was used as a local fuel. It displaced coal in heating plants, locomotives, cement and lime furnaces. Oil shale mining began in Estonia province in 1916 for supplying Russian capital Petrograd (now St Petersburg). Figure 2. GIS is only way to save information of mining technology over large areas of flat laying deposits like Estonian Oil Shale deposit. Fragment of digital map of mining technology First period. Permanent kukersite mining started as soon as Estonia got its sovereignty in 1918. One of the oldest oil shale enterprises, State Oil Shale Industry, was established. The private companies formed almost at the same time and were owned by Estonian, as well as by German, English, Swedish and Danish owners. First fifteen years, all mines used strait works technology, which meant handwork. First stripping shovels and locomotives appeared in thirties. At the same time electric drilling began. Transition to the mechanized mining began in fifties. After that, longwall mining, which was widely used by Russian coal mining, was applied. For oil shale mining, double unit face method was used. Mines applied cutters, conveyors, electric locomotives and force ventilators. In all of the mines electrification was started. Second period. The technologies of oil shale retorting that were used elsewhere in the world, failed because of local oil shale properties and partly because of economic reasons. In Estonia reliable, inexpensive and productive technology for shale oil retorting was worked out at the beginning of thirties, during The First Estonian Republic. Since 1937 shale oil export value exceeded import value of other fuels. So Estonia achieved the independence in power what was the result of the government policy. The arrangements made by the government for oil shale industry were high depreciation rate, such as 20 per cent, relief inventory from import tax and great export subsidy. This launched the progress of shale oil industry in the Baltic Basin. Oil shale processing products became some of Estonia’s essential export items. Forty five per cent of it was exported in 1938. The oil shale products and shale oil accounted for eight per cent of Estonian export. Oil shale petrol was also produced, in 1938 only 6.4 per cent of that were exported that formed 1.6 per cent in 1939 of total Estonian export. The cement industry started using oil shale to improve the quality and economy of cement production. Thanks to oil shale, Estonia became independent of foreign fuel and energy. By 1940, eleven million tons of oil shale had been mined out and the annual production reached 1.7 million tons. After the World War II, the soviet authorities immediately started to develop shale oil processing, mostly for the Baltic Sea Navy and gas generation for the city of Leningrad. The central station electric power industry started to develop in Estonia in the 1950s. Several new mines were constructed and put into operation, in 1950, the annual oil shale output was three and half million tons, and by 1955 it reached seven million tons. The oil shale was used mainly as fuel at Tallinn, Kohtla Järve and Ahtme power stations, at Kohtla Järve and Kiviõli chemical plants and at Kunda Cement Plant. Third period. Building and putting into operation new power stations (Baltic Thermal Power Station in 1965, output 1400 MW, and Estonian Thermal Power Station in 1973, output 1600 MW) increased remarkably the demand for oil shale. To meet these needs, two new mines and three open casts were opened. At the same time four mines were abandoned. The increase of mining capacity was rapid, from 9.2 million tons in 1960 to 17.5 million tons in 1970. Oil shale mining production reached its maximum level of 31.35 million tons in 1980. Building of the third thermal power station was planned as well and due to this the annual output of oil shale mining was planned to be 50 million tons. Forth period. In 1981, Nuclear Power Station was built in Leningrad province, which caused the decrease in electricity demand in the northwestern part of the former USSR. This led to the decrease of oil shale production in Estonia, 29.7 million tons in 1980, 25.7 million tons in 1985, 21.2 million tons in 1990 and 12.1million tons in 1995. Prof. Reinsalu published the first scientific prognoses of the inescapable decrease in oil shale mining in 1988. According to this, the Estonian oil shale industry would vanish in the third decade of the next century. Since the beginning of the 1990s, the consumption and export of electricity had dropped in Estonia, as it has been in all East European countries. Oil shale output decreased slowly and is now at a level of 10 to 12 million tons in a year. Figure 3. MGIS (GIS for Mining) allows extracting information from maps of mining technology. Mining durations in underground sections. Map. MapInfo Professional has been used for analyzing digital maps of oil shale mining area. All maps are created in Mining Department of Tallinn Technical University. Additional information could be found on Internet location http://mgis.gz.ee/. GIS for mining (MGIS) has been used for extracting information, like following graph that is showing inescapable end of world largest operating oil shale deposit. Figure 4. World largest operating oil shale deposit is going to be abandoned Following technologies are described on the map: 1. Advancing and retreating mining, depth in meters H = 8 - 30 m, mining duration in years = from 1916 to 1967 2. Open cast mining by handwork, Depth in meters H = 0 - 6 m, Duration in years =, from 1918 to 1941 3. Open cast mining, with first stripping equipment, Depth in meters H = 6 - 10 m, Duration in years =, from 1928 to 1944 4. Longwall mining with, partial backfilling, Depth in meters, H = 9 - 40 m, Mining duration in years = from 1952 to 1989 5. Room & Pillar mining with scraper conveyor, Depth in meters H = 10 - 75 m, Duration in years = from 1960 to 2005 6. Room & Pillar mining with LHD, Depth in meters H = 40 - 80 m, Duration in years = from 1970 to 2030 7. Longwall mining, Depth in meters H = 10 - 40 m, Mining duration in years =, from 1971 to 2000 Current open cast mining, Depth in meters H = 3 - 27 m, mining duration in years = from 1919 to 2030 The study was supported by EstSF GRANT G3403
Tellimine:
Postitused (Atom)

-
§ 13. Kvaliteedinõuetele mittevastava joogivee kasutamine (1) Kui joogivesi ei vasta käesoleva määruse §-des 4–6 sätestatud nõuetele ...
-
https://www.riigiteataja.ee/akt/126092019002?leiaKehtiv#:~:text=%C2%A7%205.%20%C2%A0%20Keemilised%20kvaliteedin%C3%A4itajad
